
 This essay presents the most recent results from an on-going research project that collects and analyzes the market prices of patent portfolio transactions. The project was initially launched in 2012 as part of the efforts to better understand the pricing behavior of the rapidly growing patent market. Several updates have been released since then, including an article published in Les Novelles, March 2013, titled “Decompose And Adjust Patent Sales Prices For Patent Portfolio Valuation” (“the Les Novelles article”); and a presentation during the 2013 Annual Meeting of Licensing Executives Society USA and Canada at Philadelphia (“the 2013 presentation”). This research note is based on the analysis of the data as of the end of 2014.
As discussed in detail in the Les Novelles article and the 2013 presentation, the ultimate purpose of the project is to decompose and adjust the market prices for patent portfolio valuation. More precisely, it will
- Establish the relationship between the number of patent assets and the prices.
- Identify and quantify major value components of the market valuation – the “peeling-off” process.
- Decompose and adjust the market prices to reflect the presence or absence of certain value components.
- Develop a Modified Market Approach (MMA) of patent portfolio valuation for patent monetization, licensing, and litigation.
All of the transactions collected were from publicly available sources, and no confidential information and data were included in the study. Most of the samples were obtained through online searches in regulatory filings, news reports, analyst reports, and other public sources. Other significant sources include major patent brokerage firms and data vendors, mainly IPOfferings, ktMINE, and RoyaltySource. For a transaction to be included in the analysis, the payment and the count of patent assets in the portfolio must have been reported. Best efforts were then applied to collect other relevant information, including the time of the transaction, organization type of seller and buyer, strategic intention, industry, technology type, seller financial health, licensing-back clause, merger and acquisition deals, and patent vs. patent applications, among several others.
Some of the data sources disclosed only an aggregate number of “patents and patent applications” or “patent assets”, and no exact count was reported for issued patents or patent applications. To accommodate this data issue, the project defines “patent assets” or “a portfolio of patent assets” to include both issued patents and patent applications. By contrast, patents or a portfolio of patents includes only issued patents.
Descriptive Statistics
As of the end of 2014, the database created by the project had 222 samples of market transactions in patent assets portfolios, with the earliest samples dating back to the 1990s. As shown in Table 1 below, the vast majority of the records are straight patent assets sales or acquisitions. Also included are nearly two dozen patent-selling or privateering deals with significant back-end payments, nearly all of which involve patent transfer or exclusive licensing to NPEs (Non-Practicing Entities) for monetization. The project has also started to collect the data of transactions with patent applications only, and several samples have been added to the data set[1].
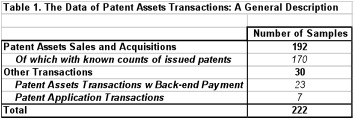
While deals with hundreds or thousands of assets paid in hundreds of millions or even billions dollars tend to dominate the headlines, the patent market transaction data over the past two decades tells a different story. Among the total of 220 samples[2] of transactions in patent assets, the median portfolio has 10 assets, while the median price is about $2.32 million. Similarly, for the 187 deals with known counts of issued patents, the median number of patents is 6, and median price, $1.68 million. Actually, 29% of patent asset portfolios have 3 assets or fewer, and 39% of patent portfolios have 3 patents or fewer.
This essay focuses mainly on the transactions that involve at least one issued patent with the back-end payment representing an insignificant portion of the deal value. Among the 192 such transactions in patent assets, 170 deals have known counts of issued patents. Table 2 summarizes the median and weighted average price per patent and per asset:
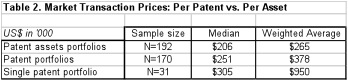
The prices reported in the table (and in the rest of this essay) are inflation-adjusted, reflecting the dollar value as of December 2014. Based on the historical data, the median price per asset is $206K, and the weighted average, $265K. For the transacted portfolios with known counts of issued patents, the median and weighted average price per patent is $251K and $378K, respectively. With sizable samples of deals that transacted only one single issued patent, we are able to conduct meaningful analysis on these particular portfolios. There are 31 single-patent portfolios, and the median price is $305K, as reported in Table 2.
Econometric Analysis
As discussed in the Les Novelles article and the 2013 presentation, a hedonic-model-like specification is designated to establish a relationship between the number of patent assets (or patents) and price, identify major value components, and quantify the value contribution of the components. The eventual goal of the econometric analysis is to decompose and adjust the market prices, so as to create a Modified Market Approach (MMA) to value patent portfolios for monetization, licensing, and litigation.
Two econometric models are created for the analysis, one for patent assets transactions, and the other for patent transactions. The dependent variable is transaction price, and independent variables include the counts of patent assets or patents, the organization type of seller and buyer, strategic intention, industry, technology type, seller financial health, merger and acquisition deals, and patent vs. patent applications, financial market index, major events (such as AIA and Alice), among several others. Except for the counts of patents or patent assets and the NASDAQ index, all other variables enter the models as dummy variables.
With R2 of 84% for both models, the specifications seem to have explained vast majority of the variances of the market prices of patents and patent assets. The following summarizes the major conclusions from the econometric analysis:
i) Nonlinear pricing. The nonlinear relationship between the transaction price and the count of patents or patent assets is statistically significant. In other words, when the count of patent assets increases, the transaction price increases accordingly, but at a slower pace. This conclusion has a critical implication to patent portfolio valuation: the per patent price derived from a very large portfolio should not be directly applied to valuing a much smaller one, vice versa.
Under MMA approach, there are two ways to deal with the nonlinear effect. First, use the econometric valuation model to value the portfolio, and let the model take care of the nonlinear effects and the effects of all other possible variables.
Nonlinear Adjustment Factor (NAF): In certain situations, we would have to apply the per patent price derived from one portfolio to another one with a dramatically different size. With the econometric valuation models, this can be accomplished in two steps. First, use the model to generate a Nonlinear Adjustment Factor (NAF) to adjust the difference in pricing caused by the nonlinearity; and second, multiply the per patent price derived from the benchmark portfolio by NAF and then apply the adjusted price to the portfolio to be valued.
ii) Technology premiums. There are statistically significant price premiums associated with several types of technologies, including mainly software, wireless, and medical and pharmaceutical technologies, though the significance levels vary slightly across the patent model vs. patent assets model.
iii) Strategic premium. The patents or assets that have strategic value in the industries carry significant premiums. Litigated patents, blocking patents, standard essential patents (SEPs), or a very large portfolio covering a wide range of technologies practiced in an industry are among the examples of strategic patents.
iv) Licensing-back discount. The transactions that granted the sellers non-exclusive licenses to the patent assets were priced with discounts. This makes sense from economics point of view, because a seller’s practicing of the transacted technology will “compete” away revenue from the buyer.
v) Financial distress discount. The assets of the sellers that were in financial distress or even in bankruptcy procedure were usually sold at discounts. The previous analysis in the Les Nouvlles article and the 2013 presentation did not find the discount statistically significant, probably because of the very limited size of the samples back then. Most likely, the discount has been caused by the seller’s desire to sell the assets in a fairly short period of time to meet the liquidity demand or satisfy the requirements from the creditors and new
Another possible reason is that the seller’s financial problem actually reflects the poor quality of the patent assets; and “bad” patents would be sold at lower price, as the story goes. As demonstrated by the literature in research fields such as corporate financial distress and technology company failure, technology is only one of the many factors, and most likely the less prominent one, that may cause financial distress or tech company failure. Actually, when technology is among the important reasons, it is more likely that the technology is ahead of the curve in market by too much. As a result, the argument that poor financial performance of an patent owner implies weak patents should be taken with a grain of salt.
vi) No NPE effect. NPEs are active players, as both buyers and sellers, but their pricing behaviors are not remarkable. In other words, there is no evidence that NPEs are overcompensated, which is consistent with the conclusions reached in two of my earlier studies (here and here). Actually, the deals involving NPEs may have been underpriced, though such an effect is not statistically significant.
vii) AIA effect. The America Invents Act (AIA) was enacted in September 2011. To test whether AIA had any significant impact on patent market, a dummy variable was introduced, which has a value of 1 for the months of October 2011 through June 2014, and 0 for all other months. The analysis shows that AIA had significantly depressed the transaction prices of patent assets.
viii) Alice effect. The Supreme Court decision in Alice v. CLS Bank (“Alice”) on June 19, 2014 certainly had sent a wave of shocks across all segments of patent market. Similar to the method for testing the AIA effect, a dummy variable is designated, which is equal to 1 for the months from July 2014 to December 2014. At the significance level of 24% to 28%, the model is unable to conclude that Alice had any significant impact on patent market price. This said, the magnitude of the coefficient of the Alice dummy variable is material, and the sign is negative, which indicates that Alice may have lowered the transaction price in patent market. It is important to notice that current database has only a small size of samples for the six months from July to December 2014. After more samples are collected for the period and in 2015, further analysis will be conducted to revisit this issue.
ix) The effect of financial market sentiment. An index representing the financial market sentiment has been added to the models for the first time. The rationale is that patent market is a segment of the overall assets market and the impact of financial market sentiment may have been priced into patent market valuation. Since majority of the samples in the database are from the high tech industries, NASDAQ index is used as an approximate to financial market sentiment. The coefficient of NASDAQ index is not statistically significant, although the magnitude is material. The positive sign of the coefficient, however, may imply that financial market sentiment could have a positive effect on the patent market pricing.
Historical Trend and Market Dynamics
The Historical Trend
The chart below illustrates the historical trend of median per patent and per asset price over the past two decades. Due to the limited sizes of samples in each year, transactions in earlier years are aggregated into the defined time periods. First and foremost, important to note is that market price of patent assets, like any other type of assets, is affected by the overall economic cycle and by the industry-specific factors. While more research needs to be conducted, the chart seems to demonstrate that the high-tech boom of 1990s was also associated with the record high patent market pricing that has not been seen since. The decline in patent price in the next two 5-year periods is most likely caused by three factors. First, the exponential growth in patents and patent applications during the time periods has dramatically increased the supply of assets. Second, the burst of the high tech bubble and the ensuing high tech downturn depressed the patent market for the period 2001-2005. Third, during the 2006-2010 period, the US economy was first hit by the financial crisis and then by the most severe economic recession since the Great Depression. The unfavorable macroeconomic conditions pushed patent market prices down to a new low.
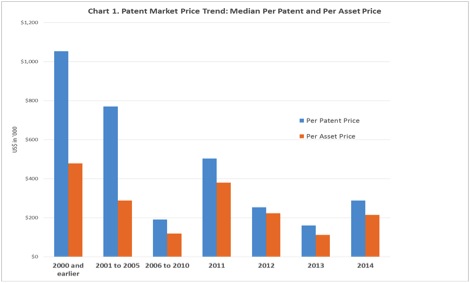
The Patent market price as evidenced above witnessed a dramatic increase in 2011, thanks mainly to the easy monetary and credit policies of the Fed. The two-year consecutive decline in market price and the subsequent increase in 2014 could be ostensibly interpreted as a correction after the 2011 spike and a natural recovery from the historical low of 2013, respectively. However, as to be explained in the next paragraphs, the fluctuation in market price during past four years might have been driven by more fundamental forces, and exploring the market dynamics can help us to better foresee and prepare for the challenges down the road.
The Market Dynamics in the Recent Years
As I mentioned in the Les Nouvelles article, back in 2012, some industry observers claimed that the Nortel patent sale in 2011 inflated market price, leading to the patent-market bubble that was about to burst, or had already burst. I disagreed back then. Two years later, the evidence from the newly-collected data seems to lend further support to my conclusion, as shown in the chart below.
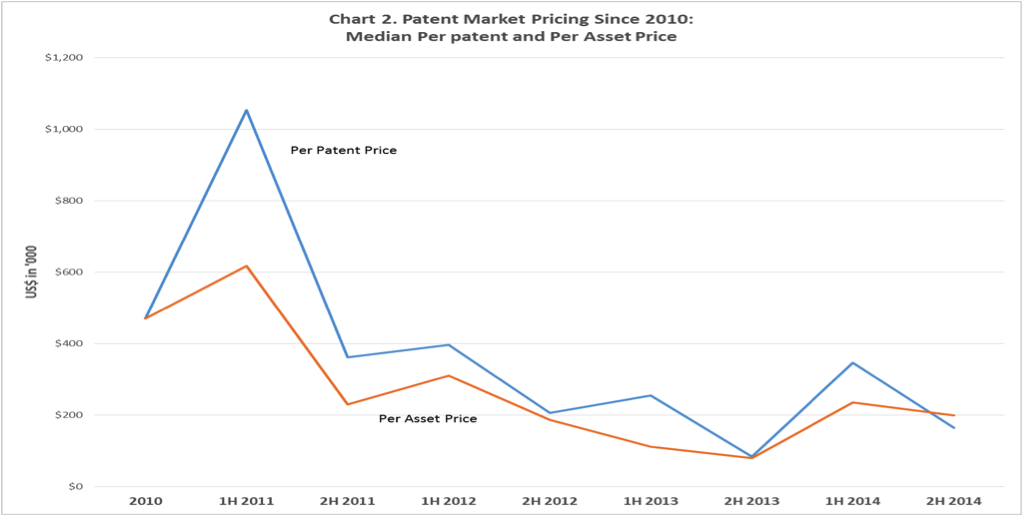
Obviously, the Nortel deal in July 2011 did not cause the so-called patent market inflation. Actually, as shown in the chart, patent market recovery predated the Nortel transaction by almost a year. The median per patent price of $470K in 2010 was significantly higher than the median of the period of 2006-2010, which was at $192K (see Chart 1 above). The recovery continued into the first half of 2011, with median patent price reaching above $1 million. In another testimony to the buoyancy of the market, RPX had a very successful IPO in May 2011.
The market price plummeted in the second half of 2011, and set off the downward spiral that stormed through the second half of 2013 when the market price reached the record low. There had been no discernible macroeconomic factors to justify the drastic decline in market price during the two years leading up to the end of 2013. As a result, the industry-specific factors might have been the culprit, among which the most prominent is the enacting of America Invents Act (AIA) in September 2011, as demonstrated by the econometric analysis above.
To be sure, I don’t mean that AIA caused the patent market crash during the period. The fact is that any newly enacted laws would cause significant uncertainty or even turmoil in the impacted market. It usually takes time for the market to digest all of the relevant information, and to revise the roadmaps to navigate through the emerging landscape. With AIA, it actually took two years for the patent market to adapt to the new market condition. During those two years, the patent market modified or even abandoned old institutions and business models while searching for and creating new ones. The uncertainty arising during the process weakened the demand and depressed the price.
Another recent example where the new legislation caused huge uncertainty in the market was Sarbanes–Oxley Act of 2002. The Act fundamentally changed the financial accounting and reporting practice of publicly traded companies, and was initially greeted with fierce resistance from the publicly-traded companies and especially from the accounting firms serving the companies. Eventually, the companies adapted themselves to the new regulation, and those accounting firms ended up being the biggest winner by profiting from helping their clients adjust. There is preliminary evidence that the patent market may be able to repeat the success story of accounting industry. As shown in Chart 1 and 2, the patent market prices had rebounded from their recorded low in 2013, and the recovery seemed to be impressive in the first half of 2014. However, Alice hit market on June 19 2014, reversing the fledgling uptrend. Now a critical question is: what’s next? Will the downward trend seen in the second half of 2014 transitory? In other words, is the decline simply a blip in a general uptrend or a definitive start of new downturn in patent market?
Unfortunately, we don’t know the answer yet. The dust from Alice v. CLS Bank has far from settled. With the Innovation Act 2015 and other patent reform bills being currently debated in the US Congress, the patent market is overshadowed again by new uncertainty. I firmly believe in our market mechanism and the resilience of patent market. I am certain that no matter how Alice will eventually play out and how draconian the legislative effects will be, patent market will recover in the long run. Hopefully, that long run is not too long; otherwise, as John Maynard Keynes once said, “in the long run we are all dead.”
___________
Footnotes
[1] Due to the small size of samples in other transactions (i.e., patent assets transactions with back-end payment and the patent application transactions), the discussion in this article will focus on patent asset sale and acquisition deals.
[2] For two of the transactions, the precise counts of the assets need to be verified.
Disclaimers and Acknowledgments
- The views expressed in this presentation are the author’s, not those of IPMAP, LLC or the data providers.
- I would like to thank IPOfferings, ktMINE, RoyaltySource, and several colleagues and friends for the help in data collection.
- Bound by NDAs, data of each individual transaction will not be disclosed. Analysis of the aggregate data will be released periodically.
![[Advertisement]](https://ipwatchdog.com/wp-content/uploads/2024/04/UnitedLex-May-2-2024-sidebar-700x500-1.jpg)
![[Advertisement]](https://ipwatchdog.com/wp-content/uploads/2024/04/Artificial-Intelligence-2024-REPLAY-sidebar-700x500-corrected.jpg)
![[Advertisement]](https://ipwatchdog.com/wp-content/uploads/2024/04/Patent-Litigation-Masters-2024-sidebar-700x500-1.jpg)

![[Advertisement]](https://ipwatchdog.com/wp-content/uploads/2021/12/WEBINAR-336-x-280-px.png)
![[Advertisement]](https://ipwatchdog.com/wp-content/uploads/2021/12/2021-Patent-Practice-on-Demand-recorded-Feb-2021-336-x-280.jpg)
![[Advertisement]](https://ipwatchdog.com/wp-content/uploads/2021/12/Ad-4-The-Invent-Patent-System™.png)


Join the Discussion
4 comments so far.
Barry Leff
May 21, 2015 07:21 amPrice per patent is a meaningless metric. You can have one patent worth hundreds of millions of dollars, and thousands of patents that are worthless.
anon_not the other anon
May 19, 2015 04:22 pmI suspect that the primary impact of the AIA and Alice is to remove potential purchasers from the patent marketplace. Fewer NPEs due to the decreased enforceability. This would manifest itself as a decline in price generally, but a significant drop in patents that are (or were) widely infringed (business method, functionally-claimed software, etc.).
Probably need a couple more years of data to be sure.
Anon
May 18, 2015 07:17 amangry_whatever_gets_you_through_the_night_(and_past_the_ban),
What is your point?
I do not think that the author here is saying that the data indicates that the AIA is the sole cause of a demise in a “patent market,” as you appear to be saying.
One problem with “stat-talk” is that those who do not understand it will impugn any take-away not liked as pure “manipulation.”
angry_as _hell_dude
May 18, 2015 12:50 amEDITORIAL NOTE: Comment deleted. Angry dude, or whatever he is calling himself, is banned for repeated violations of our comment policy. Whenever a comment is discovered it will be deleted.