Here at Juristat, in addition to helping lawyers predict the future by providing top-tier data analytics to patent attorneys and firms, we like to poke around in our data to find interesting facts, figures, and correlations to show to the world.
Global trade accounted for nearly 60% of global GDP in the last year measured (2013) and has accounted for at least 50% of global GDP since 2004. It therefore seems only reasonable for us to look at the distribution of patent applications and allowance rates at the USPTO from international applicants. To do that, we found all applications in our database with a foreign priority filing (a very good indicator that the patent had been previously applied for in a foreign jurisdiction) and analyzed them in several ways.
We looked at both overall applications and utility patent applications since 2005 for 159 different countries. From those applications, we calculated the total number of applications as well as the allowance rates ([allowed applications] / [applications that have reached a disposition]) by country, by continent, and within some major regional economic blocs to sort out who was most inventive and who was most successful in front of the USPTO.
Read on to find out (1) what countries make our list of most successful applicants, (2) which continent files the most patent applications with the USPTO, and (3) where innovation is a major export product.
Eastern Wisdom
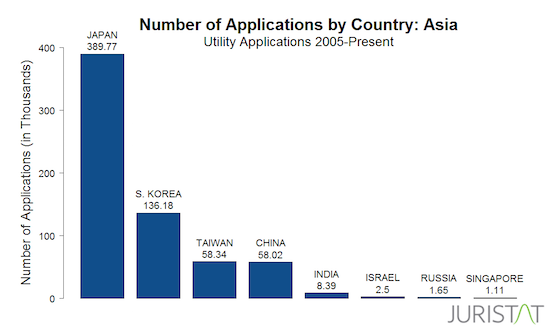
The islands of Japan are mountainous, lush, and home to many of the world’s top companies. As it turns out, Japan is also the country with the greatest number of foreign priority patent applications at the USPTO. With almost 1.1 million total foreign priority filings and over 389,000 foreign priority filings with the USPTO for utility patents since 2005, Japan is second only to domestic US patent applicants in terms of volume. While quantity does not always mean quality, Japanese filers are also the most successful in front of the USPTO with nearly 78% of patent applications allowed overall and nearly 79% of utility patent applications allowed since 2005.
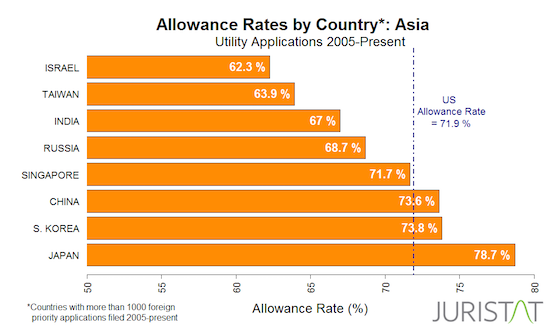
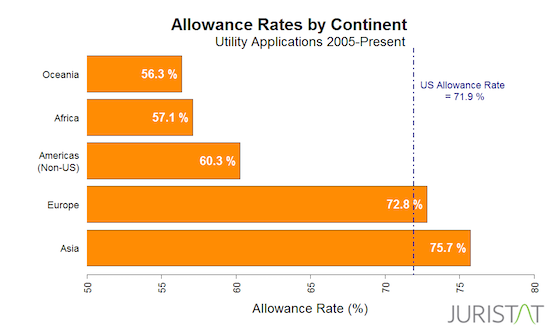
The list of top filers (those countries that have filed at least 1,000 utility patent applications since 2005) is replete with other Asian nations as well: South Korea, Taiwan, China, India, Russia, and Singapore are all represented in the list of top filers. Indeed, Asia, as a continent, files the most patents with the USPTO and is the most successful in front of it, with over a 75% allowance rate on more than 650,000 utility patent applications filed since 2005.
Better Together
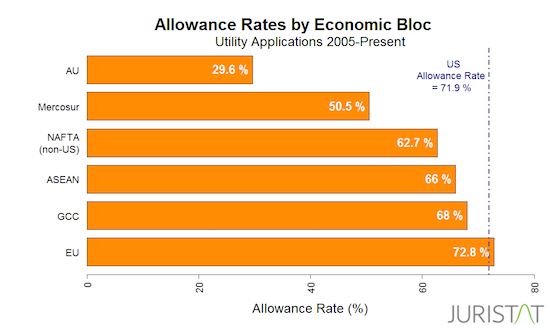
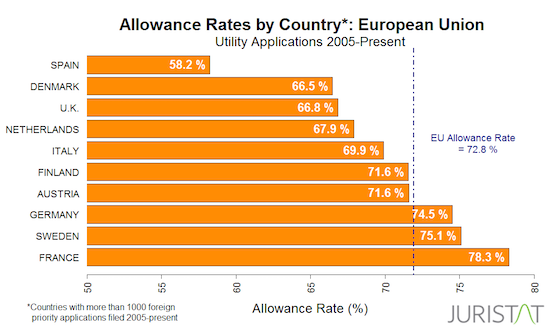
While global trade is not exactly erasing borders, there has been a trend over the last 60 years toward increasing regional integration and collective economic action. The result of this trend has been a number of regional economic organizations including the EU (European Union), GCC (Gulf Cooperation Council), ASEAN (Association of Southeast Asian Nations), Mercosur, and the African Union (AU). Within that group, the EU is both the most prolific and successful, with its member countries filing nearly 275,000 utility patent applications since 2005 with almost 73% of those allowed.
 Of the 28 EU member states, only Lithuania (86%), France (78%), Luxembourg (78%), Sweden (75%), and Germany (75%) have a higher percentage of allowances on utility patents filed since 2005 than does the EU as a whole (73%). Of non EU-member European countries, only Switzerland (75%) and Norway (74%) beat the EU-wide allowance rate. Despite their high allowance rates, however, Lithuania, Luxembourg, and Norway have submitted fewer than 1000 utility applications to the USPTO since 2005, minimizing the significance of their allowance rates and their impact on the European picture as a whole. Cypress (1 allowance on a mere 3 applications), Portugal (40 allowances of 100 applications), and Malta (4 allowances from only 9 applications) make the worst showing within the EU, though their number of applications is likewise too slim to affect EU numbers as a whole.
Enough about them, let’s talk about US for a minute
So, how do these patent applications from inventors in foreign countries stack up against the average of patent applications that don’t have a priority filing date? Approximately 4.3 million applications filed with the USPTO do not have a foreign priority filing, and we consider those to be US applications. Of those 4.3 million US applications, almost 74% are eventually allowed, and, of the 1.6 million US utility patents filed since 2005, almost 72% have been allowed. The US allowance rates are comparable to Europe’s (and the EU’s), about 2.5 percentage points less than Asia’s overall allowance rate, and nearly 4 percentage points less than Asia’s allowance rate for utility patents filed since 2005.
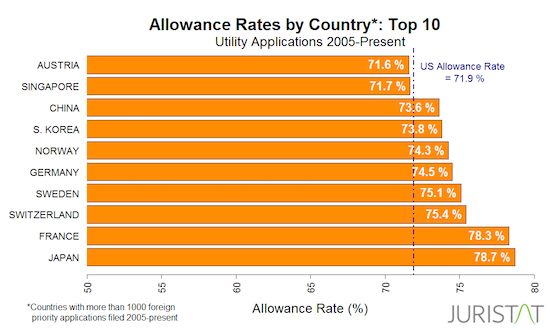
Within the set of 32 countries that have more than 1000 total applications, the US’ allowance rate (74%) is lower than that of Hong Kong (86%), Luxembourg (80%), Japan (78%), Switzerland (76%), South Korea (75%), and China (75%), making it only the 7th most successful. Among the group of 24 countries that have filed more than 1000 utility patents since 2005, the US’ allowance rate (72%) is the 9th best behind Japan (79%), France (78%), Switzerland (75%), Sweden (75%), Germany (75%), Norway (74%), South Korea (74%), and China (74%).
Enough! Why should I care?!
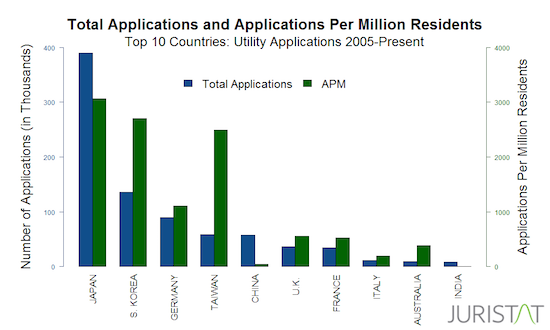
The foreign priority filing information gives a snapshot of where in the world innovation is coming from, and a relative indication of what nation’s inventors are most interested in securing protection for their IP in the United States. The numbers also give us a rough proxy for a nation’s inventiveness when we look at the number of applications per million residents (we’ll call that APM for brevity’s sake). Looked at through that lens, Japan (3048 APM), South Korea (2823 APM), and Taiwan (2514 APM), are far and away the most inventive populations with the next closest country being Germany (1099 APM). No other country besides the US (5010 APM) has presented more than 660 utility applications per million residents to the USPTO since 2005. Population data was taken from the World Bank: Total Population (in number of people).
We opened this piece by pointing to the important and growing role of global trade to the world economy. Many commentators have suggested that intellectual property rights – and patent rights specifically – will be the engine of the modern economy as the manufacturing and extractive industries’ profit margins become ever thinner. By looking at the rates of foreign filings with the USPTO – the world’s second busiest patent office by volume – and by looking at a country’s APM, we can gauge a country’s relative competitiveness in the US’ emerging knowledge economy. Knowing this can help leaders take proactive steps to better position themselves and their nations within the stream of global commerce. If we can do this for the world, imagine what we can do for you.
![[Advertisement]](https://ipwatchdog.com/wp-content/uploads/2024/04/Patent-Litigation-Masters-2024-sidebar-early-bird-ends-Apr-21-last-chance-700x500-1.jpg)

![[Advertisement]](https://ipwatchdog.com/wp-content/uploads/2021/12/WEBINAR-336-x-280-px.png)
![[Advertisement]](https://ipwatchdog.com/wp-content/uploads/2021/12/2021-Patent-Practice-on-Demand-recorded-Feb-2021-336-x-280.jpg)
![[Advertisement]](https://ipwatchdog.com/wp-content/uploads/2021/12/Ad-4-The-Invent-Patent-System™.png)


Join the Discussion
No comments yet.