
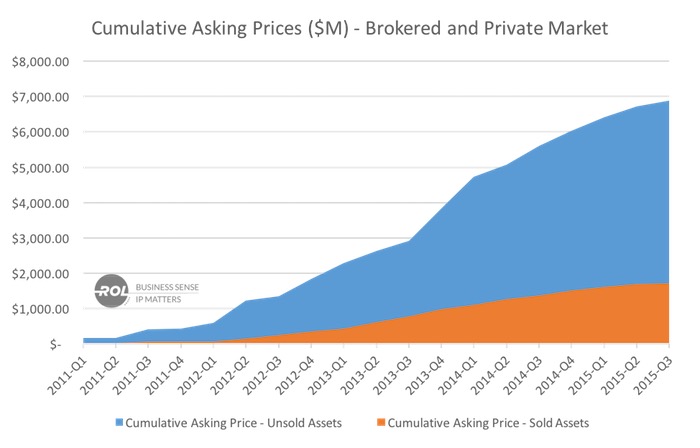
In many ways, the patent market is where the rubber meets the road in terms of patent assets. It is the place where individual patents are assigned a price in a semi-public way. It is also where companies often go for business solutions to IP challenges (see our previous post So You Want to Buy Patents). We believe that shedding light on this market brings greater liquidity to patents as business assets, and brings all inventors and patent professionals more mindshare with business leaders. We have been tracking the market since 2009 and have a database of nearly $7 billion of available patents, and we have tracked about $2 billion in patent sales.
Tracking and performing in-depth analysis of the patent market can help to answer many of the questions that patent owners and buyers have about patents including:
- What price could I get for my patents?
- Which technologies are hot?
- How have court rulings effected the market?
The patent market includes both private and public (quasi-public) patent deals. We will focus on the brokered patent market as the market is robust, diversified, and somewhat public. We say somewhat public because almost anyone could gather the information from various brokered worldwide, but it is a lot of work and is difficult.
The Brokered Patent Market
At 566 packages, the 2015 brokered patent market continues to offer a large variety of assets to meet the business needs of potential buyers. (A package is a group of patents and/or patent applications being offered by a broker/seller.) We have benchmarked our deal flow with other large corporations and defensive aggregators, and it appears that we are receiving the same number of, or more, brokered packages, so we are confident that our numbers reflect the market. The majority of the assets in these packages are US-issued patents. We believe that brokers continue to focus on US assets to increase the likelihood of a sale.
| 2015 Market Year | 2014 Market Year | % Change | |
| Packages | 566 | 556 | 2% |
| US-Issued | 6127 | 4271 | 43% |
| All Assets | 8846 | 7021 | 26% |
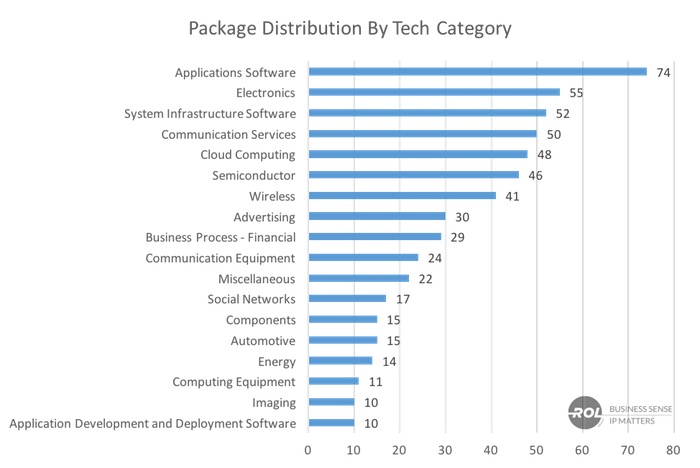
The market also presents packages from a broad and varied set of technologies. With increased diversity and a healthy number of packages, assets are available in almost any high-tech category. When we receive a package, we use the package materials to categorize it according to our taxonomy of technical areas. The distribution of general technologies is heavily skewed towards software and cloud computing. Surprisingly, court rulings on software-related technologies in Alice Corp Pty Ltd v CLS Bank Int’l and related rulings from the Patent Trial and Appeal Board (PTAB) did not result in a reduced number of software-related packages. Business process related patents most likely affected by Alice and other subject-matter related court decisions, were still strongly represented, even though the case law clearly puts those patents in jeopardy.
Asking Prices Are Down
What is the price of a patent? What is a fair price? Am I getting a good deal? These are the questions that can be addressed through pricing analysis. We use this analysis not only to help our clients buy and sell patents, but also to provide market pricing based valuation – if you know the asking market price of an average patent, you can build the model to price a patent. Importantly, this avoids having to determine an imputed royalty rate for a valuation which may be discoverable if your assets are involved in litigation. Market pricing allows you to make business decisions based on real data without jeopardizing leverage in a potential future negotiation.
Asking prices in 2015 have dropped 20% from 20014. Importantly, where the seller provided evidence-of-use documentation, pricing remained constant year-over-year.
| Asking price $ | Top and bottom 5% of data points removed from each set | |
| Per-asset | Per US-issued patent | |
| Average | $189,880 | $276,680 |
| Min | $16,950 | $30,000 |
| Max | $925,000 | $1 million |
| StdDev | $183,180 | $249,290 |
| NumData | 430 | 423 |
To impute the dollar value of a given asset, you must consider both the likelihood of a sale and a discount from the asking price (most assets do not sell for the full asking price). We can develop detailed models for our clients by drilling down on the asking prices and sale rates by technology area, package size, and other factors.
Sales Rates Are Up
The year’s sales rates appear to be up slightly up over last year’s. Anecdotally, you might think the market had fallen off a cliff, but the data shows something different. Prices may be down, but sales are up.
The market continues to be robust, but tough. Because sales data necessarily lags behind the actual market (by up to 18 months), we are analyzing the sales rate for packages listed in 2014. The 2014 sales rate is currently at about 18.4%, well ahead of 2013’s rate of 14.9% (when viewed at a comparable time on market). The overall 2013 sales rate is down from earlier years, reflecting a further drop-off in late sales (sales more than 18 months from the listing have dropped). The 51% sales rate from 2009 continues to be the high-water mark, and the market shows no indication of returning to that rate. We predict that once sales completely level off, around 29% of the assets listed in 2014 will sell.
While there is no pressure to bid quickly on undesirable packages, 80% of sales occurred within 11 months of the receipt date of the package. Some buyers can move even faster as about one-third of the sales occurred in the first four months. Accelerated decision making is a buying advantage. See our post on best practices for buying patents to help you make these quick decisions.
Combining the asking price decrease and the increased sales rates, we conclude that 2015 was a good year to be a buyer.
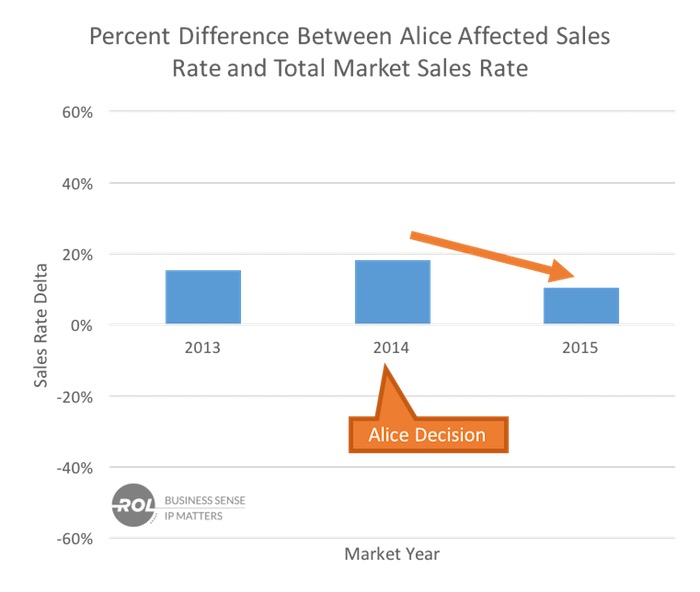
Impact of Court Rulings: Alice Hurts Fintech, But Limited Software Impact
The Supreme Court handed down its ruling in Alice on June 19, 2014, and a number of related PTAB, Federal Circuit and district court cases have since followed. We labelled each of our 116 technology sub-categories as either Alice affected or non-Alice affected. Thirty-one sub-categories – including most software, business processes, social networking and advertising – were considered to be Alice affected. Then we compared the sales rates of the *Alice*-affected areas for the market years 2013, 2014 and 2015 to the respective total sales rates. Before the decision, Alice-affected packages were selling at above the market rate; 15% better in the 2013 market and 20% better in the 2014 market. However, we were surprised to see that they are still selling quite well, at 10% better, in the 2015 market. While sales are not nearly as good as they were in 2014, the early data still shows above-average sales and demonstrates that Alice has not destroyed the market.
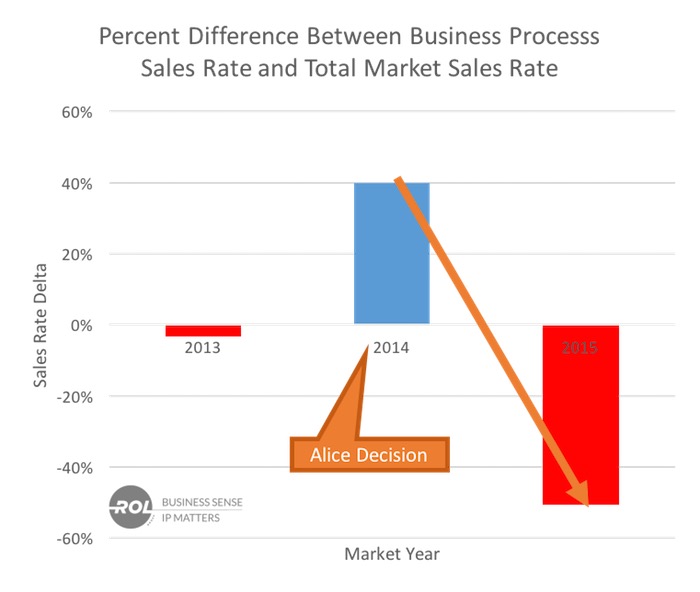
We also looked at the relative sales rates for business process and financial (fintech) patents. This encompassed seven sub-categories, including business processes (specifically e-commerce, payments and traded instruments) and minimal hardware relating to payments. These sub-categories are down from selling at a rate 40% better than the 2014 market sales rate to 45% below the 2015 market rate. It seems that the effect of Alice on the market is primarily in fintech and has not had as big an impact on software technology as a whole.
Size of the Market
The market shrunk in 2015, but not as much as one might have feared. We estimate that actual sales from June 1, 2014, to May 31, 2015, were $233 million (down from $260 million last year). When you consider that this only includes brokered and not private deals, the patent market remains quite large.
In the 2015 market, 136 sales were identified, accounting for $342 million in total asking price. We applied a 32% discount to adjust for asking to estimated sales prices, and some other factors. Thus, our expected total market size for the 2015 market is $233 million. In our analysis last year, we estimated the 2014 market at $260 million, so the market has declined by approximately 10%.
Action Plan
For prospective patent buyers, here are practice tips to help maximize the effectiveness of their purchasing processes.
When buying patents:
- state the business case for buying – identify what problem you are solving;
- model a return for your buying program;
- operationalize your buying program as much as possible – this is becoming more common and is more important for all buyers; and
- arrange your buying operations to reflect that over 90% of the patents will not fit your needs – early elimination of those patents greatly reduces your costs.
Program parameters include:
- timeline to bid – this is even more important than in previous years because the packages that are selling are selling quickly;
- budget;
- buying team authority and responsibilities;
- buying criteria;
- listing of acceptable sources of patent packages; and
- special requirements, such as a whitelist of unlicensed companies.
Conclusions
If you were buying patents in 2015, you likely did better than any previous year. The patent market, and, in particular, the brokered patent market, continues to be a robust market for buying and selling patents. Prices are down unless an EOU is available. Sales rates are up, and sales are tending to happen earlier. Caselaw impacted the market but not as much as you might have expected (Alice impacted fintech patents much more than software patents). With an estimated $233M in patent sales, we think the patent market will continue to provide interesting opportunities for both patent buyers and sellers.
For further detailed analysis of the 2015 brokered patent market, see our annual market summary which will be available for download on March 1st, 2016. Kent Richardson, Erik Oliver and Michael Costa, “The Brokered Patent Market in 2015 – Driving Off a Cliff or Just a Detour?”, Intellectual Asset Magazine, Issue #75.
Authors: Kent Richardson, Erik Oliver, Michael Costa


![[Advertisement]](https://ipwatchdog.com/wp-content/uploads/2024/04/Artificial-Intelligence-2024-REPLAY-sidebar-700x500-corrected.jpg)
![[Advertisement]](https://ipwatchdog.com/wp-content/uploads/2024/04/Patent-Litigation-Masters-2024-sidebar-700x500-1.jpg)

![[Advertisement]](https://ipwatchdog.com/wp-content/uploads/2021/12/WEBINAR-336-x-280-px.png)
![[Advertisement]](https://ipwatchdog.com/wp-content/uploads/2021/12/2021-Patent-Practice-on-Demand-recorded-Feb-2021-336-x-280.jpg)
![[Advertisement]](https://ipwatchdog.com/wp-content/uploads/2021/12/Ad-4-The-Invent-Patent-System™.png)


Join the Discussion
3 comments so far.
anon7823493
April 4, 2016 07:37 pm“see our annual market summary which will be available for download on March 1st, 2016”
Unable to find download of your 2015 annual report at the richardsonoliver website?
Very impressed with the quality of your 2014 and earlier reports.
Anon
February 9, 2016 08:26 amI reminded of trying to time the entry into a declining stock market.
Just because “price is low,” does not mean that the market has bottomed and it is time to buy.
One does have to think about whether the market will go even lower.
To this effect, I think that we have not yet come close to a bottom. We may have leveled a bit of late (or not, contrast another recent thread on this blog), but I would posit that the underlying drivers of devaluation are still very much active with no end in sight.
The giant that is Congress still slumbers as its neighbor branch of the government trespasses into the domain of writing statutory law.
Paul Morinville
February 8, 2016 10:22 pmBecause patents have a shelf life, it seems that their owners will need to sell a certain percentage of them each year regardless of price. You can’t sit on them for too long or they expire, and the value decreases with each passing day.
If that is true, this make me think that the 20% price drop is the most telling number of the market health.
A price drop this severe seems like it would also reflect in the number and value of early stage investment deals in patent centric technology startups.