
 What causes operating companies to sell their patents? Our intuition tells us that patent sales take place when the seller is in financial distress or the company is underperforming. We asked ourselves whether data aligned with our intuition.
We looked at transaction data for sales from corporations. We studied the financial condition of 20 companies across 41 transactions over the last 6 years (post 2008 financial crisis) and looked for correlations between a company’s financial health and the sale of patents. We used sales from corporations to NPEs as a proxy for all corporate patent sales. In the analysis, we found that 78% of large patent sales (>= 10 patents transferred) occurred when the companies were underperforming the QQQ ETF (an exchange-traded fund based on the Nasdaq-100 Index, which was used as a proxy for the market). Further, including the smaller transactions (4-9 patents transferred), the overall share of transactions that occurred when the companies were underperforming the QQQ ETF was 71%.
The sales behavior matched our intuition; however, we were surprised by how well it correlated with the data. We believe that significant drops in stock price can be used as predictors for when companies are likely to sell. This can help drive cross-licensing and defensive aggregator strategies for companies.
Methodology and Commentary
We reviewed nearly 100 patent transfers from operating companies to NPEs. We analyzed 66 randomly chosen transactions, all of which involved a publicly traded company and included at least four patent assets, across 28 publicly traded companies from the past 15 years. As a starting point, for each transaction, we looked at company stock price in the years leading up to the patent sale: how did the company’s stock perform over the preceding one to five years leading up to the patent sale, as compared to the QQQ ETF in the same period? In particular, we did the following calculations:
- Compared stock price two years prior to the transaction to the stock price at the date of transaction
- Compared QQQ ETF for the same dates two years apart
- Calculated the difference in performance between step 1 and step 2 (displayed as stock price vs. index in Table 1)
For a few companies where public stock data was not available, we looked at their financial performance during the relevant time frames and then included the results in the data set. Take for example the sale of seven assets on Feb 8, 2013 from Xerox Corporation to Ubicomm LLC illustrated in Table 1:
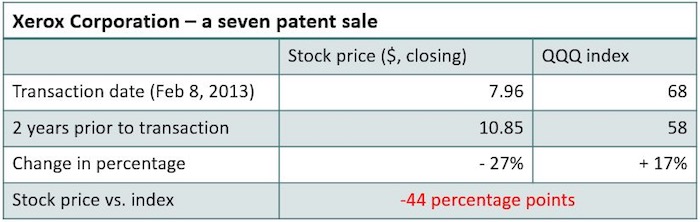
Table 1: Example analysis for a 7 patent sale by Xerox Corporation on Feb 8, 2013.
The closing price of the Xerox stock on the date the patent sale was recorded was $7.96. On that same day, the QQQ ETF was $68. On the date two years prior to the transaction date, Feb 8, 2011, the stock price for Xerox was $10.85, and the QQQ ETF was $58. So while the Xerox stock price had dropped from $10.85 to $7.96 (-27%), the QQQ ETF had gone from $58 to $68 (+17%), thus the difference between the Xerox stock and the QQQ ETF over the same period was -44 percentage points.
We compensated for a significant decline in the overall financial health of the stock markets during some of the sample period. We set a minimum difference of 5 percentage points as a threshold and repeated the analysis for the 66 transactions across the 28 companies. Where the stock underperformed the QQQ ETF by more than 5 percentage points, we concluded that the company in question was underperforming relative to the overall market. What we wanted to achieve by setting a threshold was to avoid accounting for the cases where a company just barely underperformed. By setting the threshold to 5 percentage points, we counted the companies who had a more substantial underperformance relative to the index. Increasing the threshold to a minimum of 10 percentage points reduced the percentage of transactions that occurred when the company was underperforming by less than 5 percentage points.
When reviewing the results, we noticed that transactions occurring around the financial crisis (2008-2009) were unrepresentative for this study; however, it is interesting to note that the observed trend was not as pronounced prior to the financial crisis. For that reason, we decided to limit our set of samples to only include transactions recorded after Dec 31, 2009.
Furthermore, we believe that two years is a reasonable minimum period in which poor commercial results lead from the conception of the idea to the actual sale. In our experience, it usually takes 6-12 months to have an action plan approved by management, and then the selling process usually takes another 6-12 months. We also tested for three, four, and five years, and we found there was a trend in the stock price that conformed with the other results.
Furthermore, a core assumption we have made is that a company’s stock price is representative of its financial health. There is a number of financial metrics or key performance indicators that could have been used in its stead, but stock price was a good initial candidate. Of course a downside of this method is that only publicly traded companies are easily included in the analysis.
Our initial analysis focused primarily on US-listed tech companies because such companies have been selling patents for more than 10 years and the QQQ ETF data was readily available. We think expanding the analysis to other geographies would be particularly interesting.
Results
We found a significant indication that companies who sold patents to NPEs were in financial distress at the point of sale. 78% of large patent sales (>= 10 patents transferred) occurred when the companies were underperforming the QQQ ETF. Including the smaller transactions (4-9 patents transferred), the overall share of transactions that occurred when the companies were underperforming the QQQ ETF was 71%. If stock underperformance were not a factor, we would have expected to find less than 50% of the companies underperforming.
Alternatives and Future Research
As mentioned, stock price is a readily available indicator of a company’s financial health: it has the benefit of being public knowledge and easily accessible. The downside is that the comparison can only be made by companies listed on a public stock exchange. Therefore, a suggestion for future research is to see if a similar analysis using a different metric for a company’s financial health is possible (e.g., funding rounds).
Furthermore, with the correlation between underperformance to the market and its leading to patent sales confirmed, further research in this area becomes more appealing. This opens up the opportunity to develop an automated tool with a broader scope that could be used to get results with finer granularity. For example, checking other financial measures might be worthwhile.
We chose the QQQ ETF because of its ready availability and widespread knowledge of the underlying Nasdaq-100 index that the ETF tracks. We considered creating a custom index based on the historic stock data for similarly situated companies; however, the added complexity, especially challenges with communicating and validating an index’s credibility, was not deemed worthwhile.
Other considerations for reviewing this analysis include: whether a large sector of the tech industry underperformed the QQQ ETF and whether the sales were only from that sector. We ended up sampling 41 transactions from 20 companies, so a broader sample could yield different results. Use of a different time frame in selecting the sample of stock prices may be more effective or show different results. Additionally, a general decline in the overall market, as opposed to a specific company’s decline, may be important to driving sales activity. Lastly, for future studies, we suggest looking into whether or not the company, at the time of transaction, had sold patents before, and then factoring that into the likelihood of the company selling again. From experience, we have observed that companies who have sold patents once are more likely to sell again, since they already have their internal processes set up.
Conclusion
Our results support the intuition that companies sell patents when in financial distress. 71% of the sales occurred when the seller underperformed the overall market by more than 5 percentage points. This suggests that a strategy of focusing cross-licensing and defensive aggregator usage on companies that are “at risk” can significantly reduce your company’s exposure to patents sold to NPEs and competitors.
As additional research continues, we will be working on predictive tools to identify companies at higher risk for selling to NPEs.


![[Advertisement]](https://ipwatchdog.com/wp-content/uploads/2024/04/Patent-Litigation-Masters-2024-sidebar-early-bird-ends-Apr-21-last-chance-700x500-1.jpg)

![[Advertisement]](https://ipwatchdog.com/wp-content/uploads/2021/12/WEBINAR-336-x-280-px.png)
![[Advertisement]](https://ipwatchdog.com/wp-content/uploads/2021/12/2021-Patent-Practice-on-Demand-recorded-Feb-2021-336-x-280.jpg)
![[Advertisement]](https://ipwatchdog.com/wp-content/uploads/2021/12/Ad-4-The-Invent-Patent-System™.png)


Join the Discussion
2 comments so far.
GGF
August 17, 2016 01:12 pmInteresting research. I think the sale of patent portfolios by failing public companies is also fueled by the need for these companies to provide good quarterly results at the expense of the future. If the failing company was able to focus on the longer term, they may be less likely to sell their patent portfolios. I suspect that private companies sell their portfolios more as a component of corporate acquisitions rather than failure.
Also, I wonder how many of these failing companies approached operating companies and were rebuffed so they ended up selling to NPEs. Are operating companies under the assumption that once the failing company goes bankrupt, the patent portfolio dies with the company?
Tuomas Matila
August 17, 2016 08:55 amThanks for the interesting article! As you wrote, the result does support the intuition that companies sell patents in financial distress. But why is it so? Why don’t they sell patents when everything is well? Is it because the patents are seen the most valuable assets they own or is it because the companies do not realise earlier that the patents can be valuable trade items? I vote for the latter one.
There are many good arguments for selling patents also when you are not forced to. The technology they relate to is no longer relevant for the company, the portfolio may be too large causing saturation of the value etc. Selling patent should be one of the basic tools you use in managing the patent portfolio. With the money earned (and saved from annual fees) you can file new applications or buy more useful patents from the market!