
This is part 3 of a 6-part series on our 2016 Patent Market Report. To begin reading from the beginning please see 2016 Patent Market Report: An Overview.
 What is a good price for a patent? Are you getting a great bargain or are you being overcharged? Are you overcharging or selling yourself short? Whether as a buyer or a seller, those are hard questions to answer without comprehensive pricing analysis. In the absence of a truly public market in which a buyer or seller can look at comparable packages, many questions arise around pricing. It is difficult to know what is a fair price, a bargain price or a good deal. We continue to address these questions with our pricing analysis. We use the pricing analysis not only to help our clients buy and sell patents, but also to provide market-based pricing – knowing the asking price of an average patent allows us to model the price of a specific patent or package. As an added benefit, this method avoids discounted cash-flow analysis and having to determine an imputed royalty.
We believe that the availability of market pricing data helps to create liquidity in the market. For example, a novice seller approached one of our clients with a $33 million price tag for his three patent assets. With no other data, he had picked a number that he thought was reasonable. We sent him a copy of our annual market paper which he used to reprice the package at a much more reasonable $350,000. The seller moved his asking price from $33 million to $350,000. However, as the market matures, other use cases for the data arise. Recently, two companies on opposite ends of a deal used the same pricing data to argue two very different prices for the same assets; in this case, the data provided a useful structure for a pricing conversation.
Our key takeaway from pricing data is that asking prices have stabilized from 2015 to 2016 (see Table 3). Asking prices have changed only negligibly from last year, both per asset and per US-issued patent. Average price per asset increased by 3.7%, while average price per US-issued patent dropped 0.8%. The standard deviations, though still quite large, have also dropped. It is possible that the fall in asking prices has been arrested.
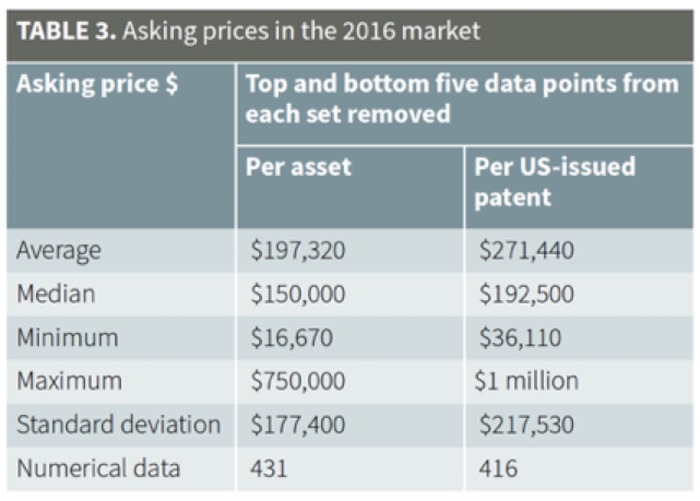
Figure 7 shows the distribution of asking prices. The data shows a continued focus on packages priced between $250,000 and $2 million – 65% of all packages fall into this range. Here, brokers make a healthy commission while keeping purchases within buyers’ budgets so that no one deal ties up the entire budget.
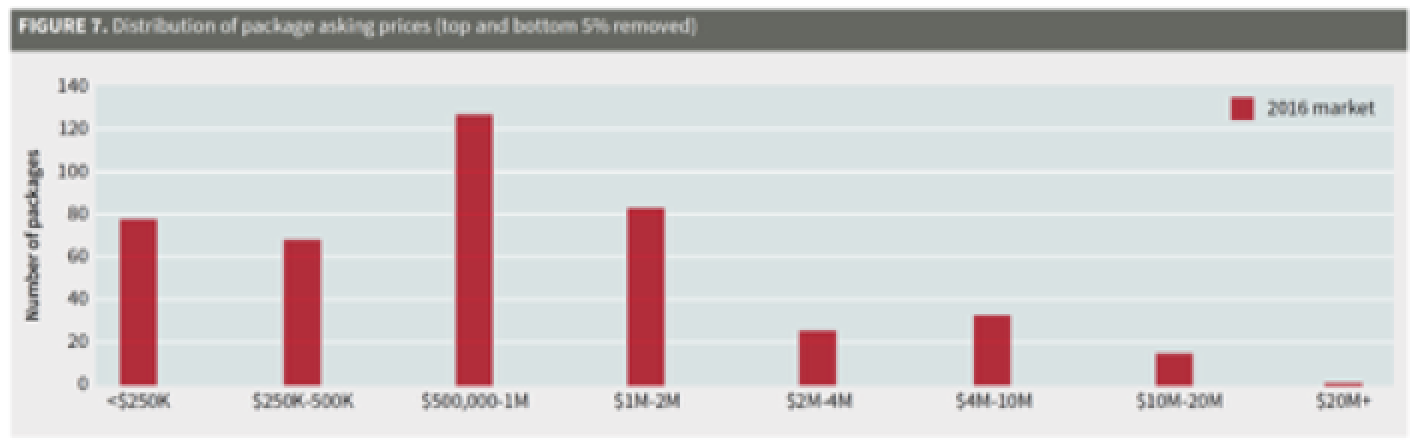
We also continued to track the sub-$250,000 price range separately – an interesting range, as it represents relatively low margins for a broker. We saw an increase in these packages: 18%, up from 13%. Assuming a 25% commission for brokers, a maximum $62,500 commission is possible for such packages. Additionally, when one takes into account the overall modest sales rate of packages, brokers have been finding ways to lower their costs. There are rarely EOUs for packages priced below $250,000 and in buying such packages, we advise clients to scale down the resources that they invest in diligence and negotiating the patent purchase agreement – unless they have significant plans for the patents. There is little to no pricing information on IAM Market and therefore IAM Market data was effectively removed from this dataset.
When excluding data from IAM Market, 82% of packages came with pricing guidance. This is almost exactly the same as the 84% last year and 83% in 2014. We believe that pricing clarifies expectations for both buyers and sellers. Additionally, 28% of packages with pricing guidance had exact asking prices, up from 26% last year. Packages without pricing guidance continue to put themselves at a disadvantage, as sales rates for such packages lag behind the market.
Clear pricing guidance helps buyers to make decisions – without guidance, the risk of no decision is higher (meaning no sale), simply because the seller is signaling a potential lack of understanding of where the market is. On the other hand, because asking prices have become more concrete, we have noticed that more of our clients are citing price as the reason for passing on a purchase. This is helpful for both sellers and buyers, as time and money are saved by not performing diligence on packages that would never close (more on this below).
Per-asset pricing by package size
We analyzed the interaction between pricing guidance and the number of assets in a package (Figures 8 and 9). Unsurprisingly, on average, price per asset drops considerably as the size of the package increases (from almost $400,000 to just under $50,000). This is consistent with last year’s data.
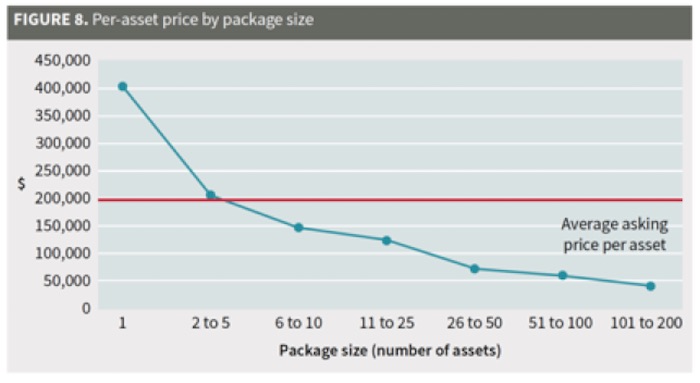
In most cases, we advise sellers to take the time to find and highlight the key patents and group those into smaller packages in order to increase the overall price per asset. However, under certain circumstances and where portfolios are large, bulk packages provide a better selling opportunity. Despite the premium for these key patents, breaking them out may leave a package with many undifferentiated and ultimately unsold assets. In this situation, a seller may get a better return by selling a greater portion of its assets at a lower rate. This calculation continues to be difficult and benefits from up-to-date knowledge of the market and in-depth knowledge of the specific portfolio.
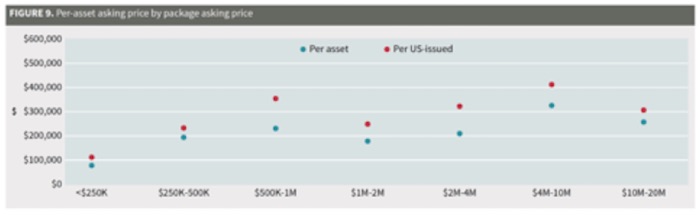
When comparing the per-asset price to the asking price for packages, we found that per-asset pricing is relatively constant in the pricing brackets from $250,000 to $2 million, with the low being $180,000 per asset and the high being $234,000 per asset (Figure 9). We observed a slight premium on asking prices in the $4 million to $10 million range – $323,000 – which was not seen in 2015. However, the $10 million to $20 million range per asset prices dropped significantly, from $356,000 to $257,000. Because of a limited number of packages in the $4 million-plus range, it can be challenging to draw firm asking price conclusions for those packages. However, it may be that sellers are becoming more reasonable; the outliers in the $4 million to $10 million range are being driven by smaller packages with many EOUs, as opposed to large undifferentiated packages. Price per asset continues to drop for packages below $250,000, indicating higher-risk or lower-value patents (eg, no infringement, recent priority dates or almost expired patents).
Asking Price: Patent prices by tech category
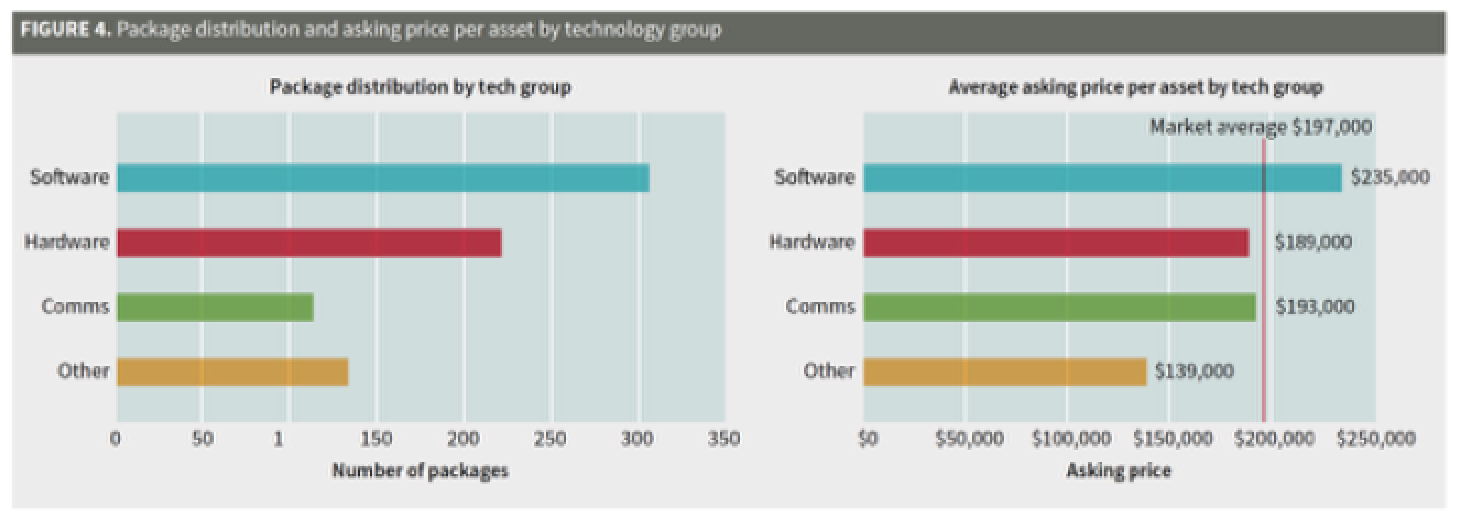
Returning to Figure 4 from Part 2 of our 2016 Patent Market Report, some technology categories continue to drive strong asking prices, with software still commanding the highest prices, despite Alice. The highest asking price per asset – cloud computing, a sub-category of software – commanded 211% of the asking price per asset compared to packages in the sub-category energy. However, the deviation across categories has fallen significantly. In the 2015 market, the highest priced tech category commanded 322% of the lowest.
Alice-affected technologies
Technologies relating to internet computing have maintained high asking prices, despite the potential implications of Alice. Additionally, Alice-affected packages are still listed fairly consistently. We have observed no drop-off in the listings of these packages as people continue to try to sell them. However, the sales rate of Alice-affected tech areas, especially fintech, has fallen – as discussed further below.
Broker asking price and impact of EOUs
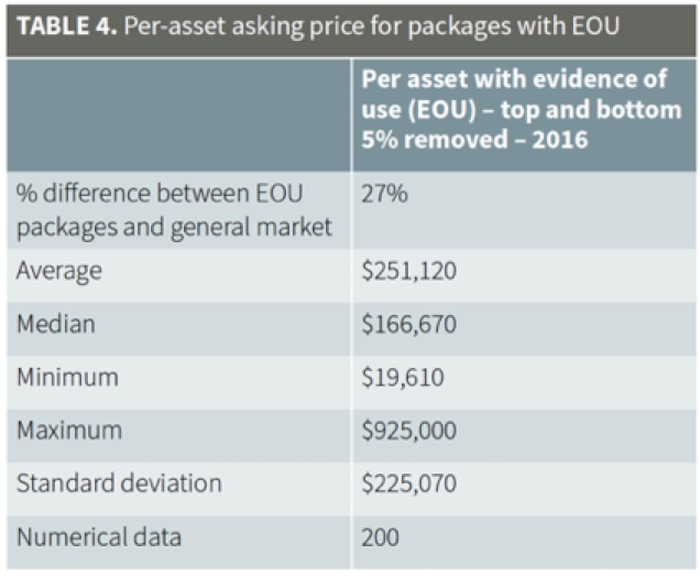
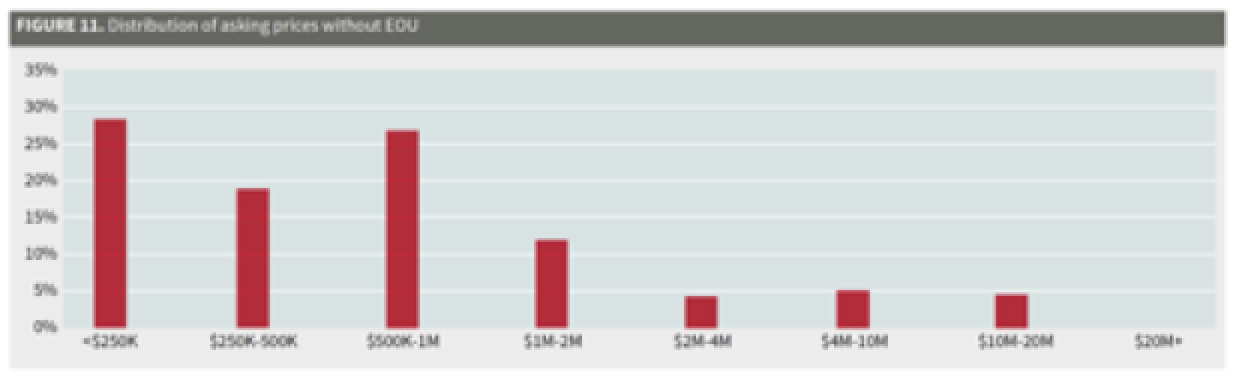
If you can, include an EOU in your patent sales package: the pricing premium is worth it. The
actual EOU pricing premium in the 2016 market is approximately $54,000 – a 27% premium (Table 4). This is down from the $60,000 (34%) premium of 2015, although this drop remains well within the pricing variance. Just as we observed in the 2015 market, Figures 10 and 11 show the pricing premium for EOUs with a clear upward shift in per-asset asking prices when EOUs are provided.
Brokers appear to have acknowledged this premium as well and have increasingly included EOUs in their marketing material. Excluding IAM Market (which has significantly more packages for sale by owner), the percentage of offering packages with EOUs rose from 37% to 43%. We continue to see brokers asking sellers for upfront fees to cover some of the costs of preparing the offering package, including EOUs.

Key diligence data
When discussing potential patent purchases, we continue our efforts to end use of the phrase ‘low quality’ with regard to broadly characterizing patents. We often hear that there are ‘junk,’ ‘low-quality’ or ‘weak’ patents on the patent market. Clearly, there are some patents which we can objectively agree are low quality. However, the majority of patents are never tested for quality metrics (eg, enforceability) because this is simply too expensive to test. If buying, you should be doing so with a purpose and therefore analyzing the value of the assets in a particular context or for use in a specific business need. A patent needed for litigation must pass much higher diligence tests than one needed to de-risk a future alternative technology choice. Additionally, the first patent that you buy may need to meet different diligence tests from the 800th. While the best patents will stand up to litigation, most patents will have very different use cases – understanding this can help to set your patent buying program.
We’ve worked with Mark Lemley of Stanford University on a forthcoming analysis of litigation results for transferred patents by examining a data set of US patents which were transferred and litigated through judgment. The initial results contradict the received wisdom that we’ve heard from some general counsel and chief IP counsel that one cannot successfully litigate a purchased patent. Purchased patents can be and are litigated successfully – albeit for operating companies, less successfully than organic patents. The litigation success rates vary by purchaser type and we recommend analyzing the full results when the paper becomes available and using them to adjust purchase models accordingly for your company. As noted above, some caution is recommended here, as litigation is but one, fairly narrow, use case for purchased patents.
When a buyer looks to buy patents, the business use case tends to be narrow compared to the pool of packages available on the market. The vast majority of packages will not fit the business use case, irrespective of their quality. Put another way: if the claims, prior art, prosecution and applicable markets for any given package were all perfect, would you still want to buy it? The answer is most often no. However, the same assets could be exceptionally useful to another buyer. Packages that do not fit a buyer’s specific use case should be immediately removed from consideration in order to reduce diligence expenditures, meaning that testing quality becomes irrelevant. This is one of the many techniques which can be used to reduce the costs in a patent purchase program.
Based on our data, a small percentage of all the packages on the market will fit a company’s specific business needs. For this article, we submit that this highly concentrated distribution of value to a particular buyer in the overall market presents a log normal distribution, similar to most companies’ patent portfolios. This is an extrapolation of Suzanne Harrison’s analysis of multiple corporate patent portfolios in her book Edison in the Boardroom.
Working with the model that value is highly concentrated, how should you deploy your diligence resources? Figures 12(a) to (d) demonstrate a tiered diligence process to highlight the importance of quickly eliminating ill-fitting packages.
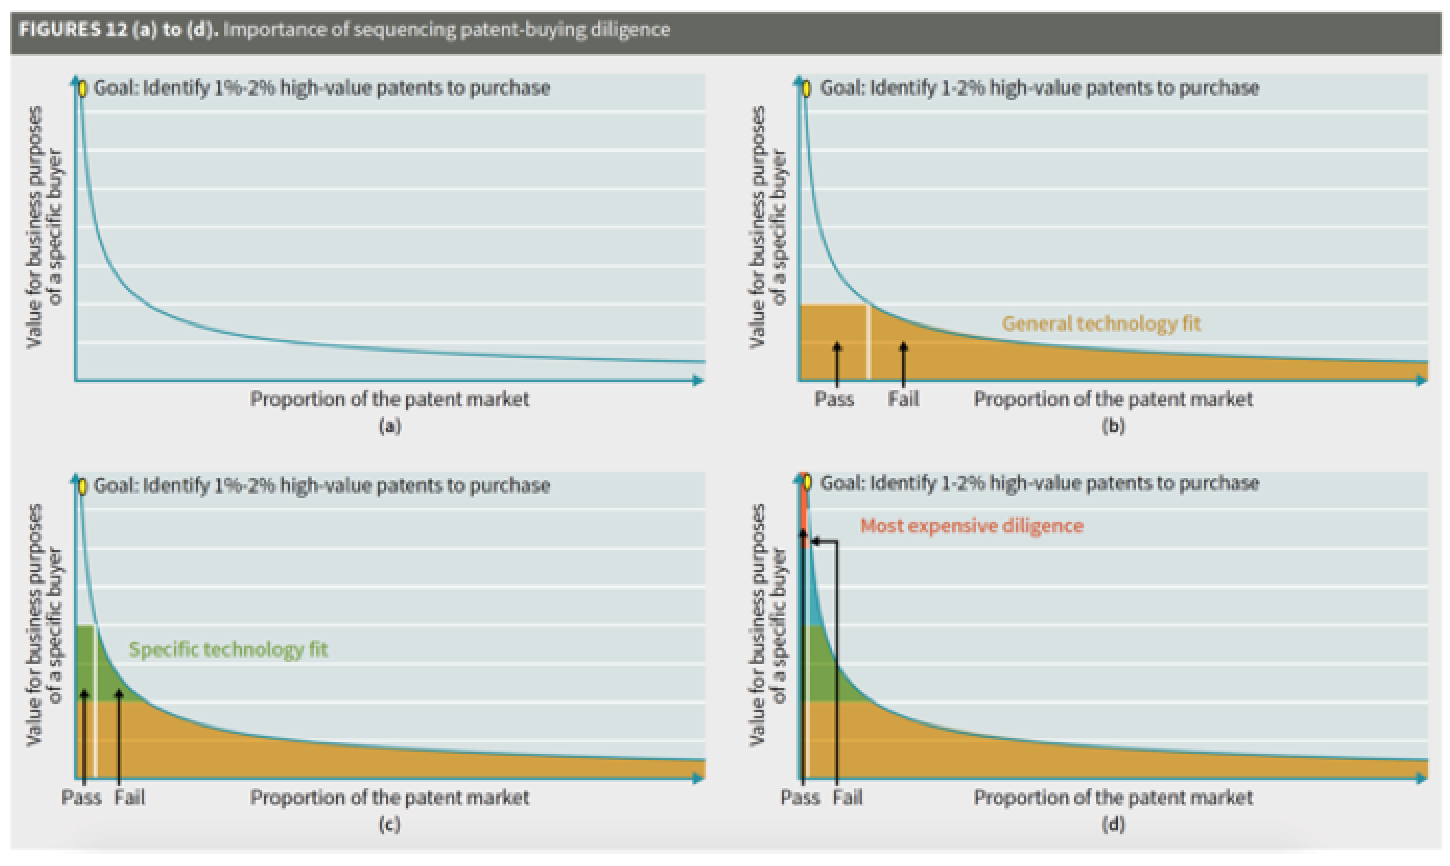
Figure 12(a) shows the entire market with value distributed according to a log normal – the goal is to identify the 1% to 2% of high-value patents to purchase (highlighted in yellow). The first diligence step at Figure 12(b) is to test the package for general technology fit test (eg, wearables). The gold area shows the percentage of the market that is subjected to this test; a large section of the market is immediately eliminated (pass versus fail side of white line). The next step (Figure 12(c)) is to see whether the technology described is something of specific interest to the client (eg, heart rate monitors) – the green area shows the percentage of the market where this test is applied and again much of the remaining market is eliminated (pass versus fail side). The question at this stage could be: if we assume that the patent is otherwise perfect, would we still buy it? Where the test is applied, the answer is no 70% of the time (everything that has failed the first two tests).
The process can continue with multiple diligence phases. We show the conclusion of a four-phase process in Figure 12(d), where two more rounds of diligence are conducted. The first involves inexpensive tests, such as remaining life of the patents, bid due dates and pricing. Again, these tests are applied to a very small part of the market (the blue portion). Finally, expensive diligence is applied to only a few percent of all the market (the orange portion).
Table 5 shows the specific reasons that our clients gave for passing on these packages. In terms of Figure 12(d), this aligns with the distribution of results on packages being tested in the blue and grey areas. Pricing as the reason for passing is up to 24% (previously 15%), making it the top category for the first time. We believe that this reflects a recognition by buyers that asking prices are more stable and less negotiable. In particular, some of our clients have become more price focused. Brokers should assume that asking price is becoming more important and that people will react to it differently than in previous years.
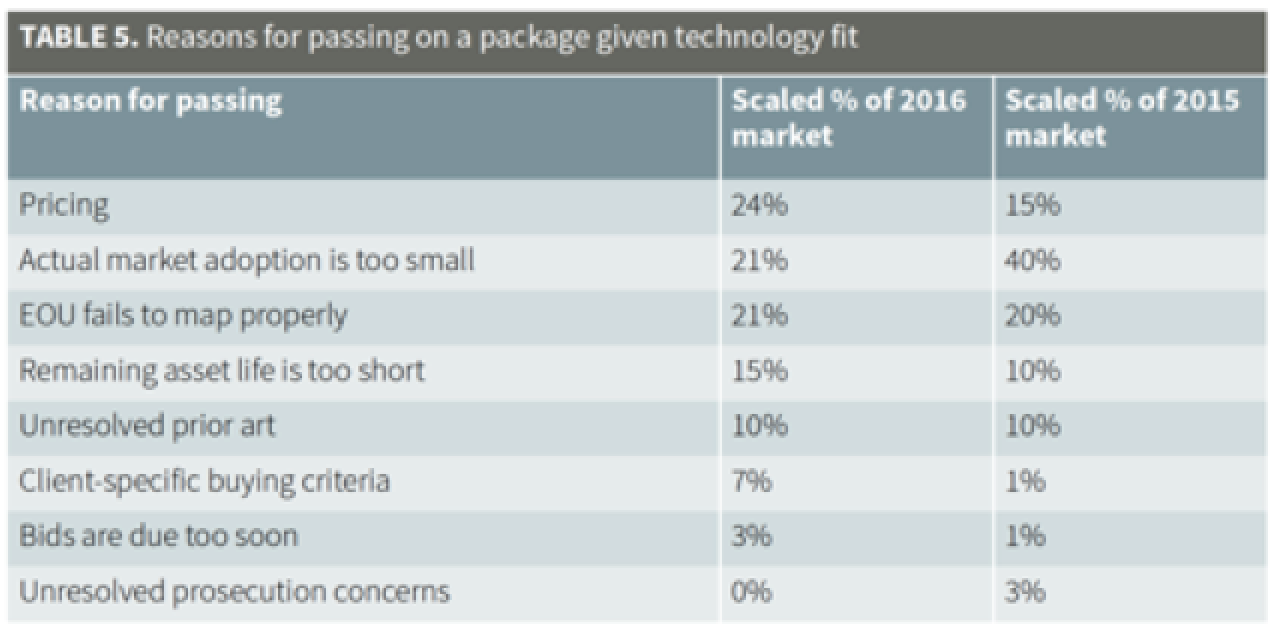
Some issues that might be expected to cause client concern rarely cause a package to be eliminated. For example, where the bid due date is too soon, brokers are often willing to move it. As in previous years, buyers continue to improve and systematize their buying processes, resulting in fewer packages receiving expensive diligence.
CLICK to CONTINUE READING… In Part 4 of our 2016 Patent Market Report, we’ll dive into patent sales. How did sales rates in 2016 compare to previous years? What impact did Alice have on patent sales? Who were the sellers and buyers in 2016? Stay tuned.


![[Advertisement]](https://ipwatchdog.com/wp-content/uploads/2024/04/UnitedLex-May-2-2024-sidebar-700x500-1.jpg)
![[Advertisement]](https://ipwatchdog.com/wp-content/uploads/2024/04/Artificial-Intelligence-2024-REPLAY-sidebar-700x500-corrected.jpg)
![[Advertisement]](https://ipwatchdog.com/wp-content/uploads/2024/04/Patent-Litigation-Masters-2024-sidebar-700x500-1.jpg)

![[Advertisement]](https://ipwatchdog.com/wp-content/uploads/2021/12/WEBINAR-336-x-280-px.png)
![[Advertisement]](https://ipwatchdog.com/wp-content/uploads/2021/12/2021-Patent-Practice-on-Demand-recorded-Feb-2021-336-x-280.jpg)
![[Advertisement]](https://ipwatchdog.com/wp-content/uploads/2021/12/Ad-4-The-Invent-Patent-System™.png)


Join the Discussion
4 comments so far.
angry dude
April 19, 2017 12:02 pmGene,
I am just telling the facts from my very personal experience a few years back – just before AIA kicked in
If you think that situation is better now (with PTAB, IPRs etc etc) then you are obviously wrong
P.S. Do you really think that ICAP Patent Brokerage (former Ocean Tomo) people are somehow stupid or unqualified and didn’t know how to evaluate and select quality patents for their auctions ???
Gene Quinn
April 19, 2017 11:19 amAngry Dude-
Thanks for your comment. You are, of course, entitled to your opinion. As long as you realize you are wrong we are good.
-Gene
angry dude
April 19, 2017 10:38 amHow bout zero, zilch, nil ???
That’s what most sellers (individuals and small entities) got at the ICAP Auction a few years back – even before AIA kicked in
That was a real open market price for thoroughly wetted patents: 0 dollars and 0 cents
Out of about 60 patent assets played out in an open outcry auction only 4 or 5 sold for nothing even close to the figures in this article
I can attest that quite a few of those patents were of very high quality, including mine
Since then ICAP stopped those embarrassing and self-humiliating public outcry patent auctions and turned into closed corporate circle with unknown (corporate) sellers, buyers and prices
I call bs on your data – there is currently no real patent market at all, just imitation
Eric Berend
April 19, 2017 09:38 amThis article reflects a dysfunctional bifurcation in the “market” for patents. For smaller entities such as individual inventors and most startups, this reads like the scorecard of a foreign sports league. Thus, you parasites derogate us, talking over our heads, as if you represent the only legitimate activities in the U.S. patent industry.
A smaller inventing entity will most likely never have dozens of patents; and it is instructive here, that the magnitude of change in the example given, that of a patent seller with three patents; reduced the asking price by some 99%. Surely, that pleased your precious, exalted Prof. Lemley.
If this is the model you advocate:
1. charging 25% or more – an outrageously rapacious rate to levy against a property owner for brokerage services;
2. just to reduce the benefit by enormous proportions, so as to suit your cabal’s impositions upon this distorted and damaged marketplace; and,
3. together with your friendly association with the infamously anti-patent Prof. Lemley;
then, it is abundantly clear, that you are NO FRIEND of actual, real-world inventors.
Do you really think a wall of text and some pretty illustrations, serves to sufficiently mask your avaricious exploitation, from inventors and patent owners; who are now, finally on notice as to how the whole house is burning down? Or perhaps, to somehow assuage our natural property concerns? Then – the more of a fool, you are!
This hit piece in clumsy disguise, serves only to highlight your and your firm’s attitudes of entitlement to pernicious exploitation of intellectual property owners.
That “…software still command[s] the highest prices, despite Alice”, is strongly indicative of the gigantic influence of that industry, in its illicit power grab over other industries relying on patents, in the IP space.
Seriously: for those of us who still believe in the classic U.S. Constitutional bargain as embodied in Article 1, Section 8, this ‘article’ reeks of derision. We DO NOT play the aggregation game, where lousy patent quality has been engendered by – precisely who? The very same ilk, as you.
Your “industry’s” obdurate focus on large entity accumulators and quantity, rather than actual patents of quality: is precisely what has engendered this degradation of property values, in the patent space of IP. Now, in that aftermath, deliberately manipulated with industrial actors motivated to degrade the pecuniary value of U.S. patents, you have the massive temerity to blithely condescend towards the “little people” of the patent space – ACTUAL, REAL-WORLD INVENTORS can just get drowned and go die.
Well, it isn’t working for you parasite exploiters, any more – the so-called ‘suckers’ we call inventors have woken up; and are no longer disclosing our inventions to your fraudulently misrepresented processes: that are now rigged exclusively to our massive harm and appalling expense, to unjustly enrich everyone else, except the ACTUAL INVENTOR.