
This is part 4 of a 6-part series on our 2016 Patent Market Report. To begin reading from the beginning please see 2016 Patent Market Report: An Overview.
Though patent sales rates have decreased in 2016, the patent market remains viable and robust. We continue to see a trend in the increased speed at which packages sell (over 50% are sold within four months) as well as an increased sales premium for packages with Evidence of Use (EOU) — a 27% price boost. 2016 also saw a rise in sales rates from larger patent packages; its highest sales rates were from packages with between 11 and 25 assets, an increase in package size from 2015, which counted its highest sales rates from packages with six to 10 assets.

Sales rates are down from 2015, which were themselves down from the previous year. This fall is likely the result of the drop-off in NPE buying, continued negative litigation outcomes for patent holders and a general calming in the bigger patent wars. While this represents a significant challenge for new entrants in the brokered market, overall sales rates have not fallen off a cliff (see Figure 3). Further, a number of the sales made since our last report were of older packages (eg, a number of packages listed in calendar year 2013 sold). This finding accords with the bidding recommendations discussed below in connection with Figure 14: desirable packages which address business needs move fast, followed by a long, slow tail of additional sales.
Turning to the sales analysis, our methodology uses the US Patent and Trademark Office (USPTO) assignments database to identify sales (if at least one patent in a package is found to have a sales assignment, that package is treated as sold). We use the execution date as the date of sale. The data is limited to packages received by May 31, 2016 and to sales recorded with the USPTO by August 21, 2016. When discussing sales, we switch to a different data set, which includes 2,273 packages, with 441 identified by sales that are measured by the calendar year. This sample set includes packages which were analyzed in our previous articles and goes back to packages listed as early as 2009.
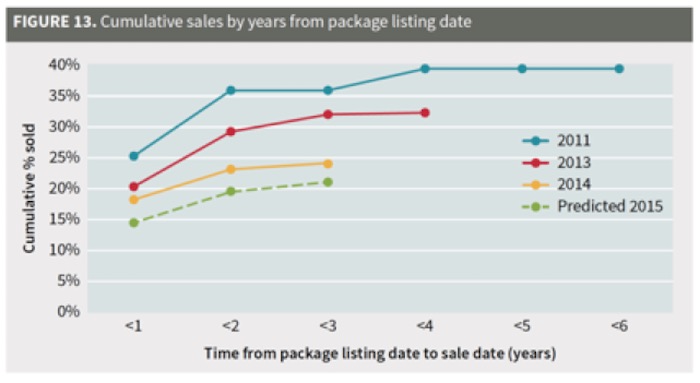
Our 2015 sales rate is currently at 10.4% (compared to 18.4% for 2014 and 14.9% for 2013 at the same juncture for each). To project the 2015 calendar year sales (Figure 13), we estimated that by the end of 12 full months, approximately 14% of packages would have sold. We then projected the future sales for an additional two years based on the slower rate of sales for packages listed in 2015 compared to those listed in 2014. The sales rates from packages listed between 2012 and 2014 were used to estimate how quickly 2015 listed package sales would fall off in subsequent years. Looking at this projection compared to 2011, 2013 and 2014 sales rates show a trend of declining success rates for patent sales.
Predicting the direction of the market is challenging. Looking back at our projections over the past few years, we see that the 2013 listings finally caught up with our initial projection of 32%, but it took two years for them to do so. However, our projection of 29% for 2014 listings has not yet been achieved (currently 24%). While not shown on the graph, the 51% sales rate from 2009 remains the high-water mark, with no indication of sales returning to that rate.
Sales by package size
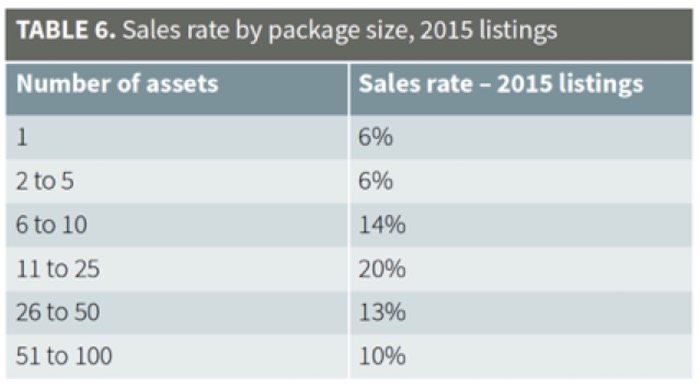
We analyzed the sales rate based on the size of the package listed and Table 6 illustrates that the highest sales rate occurred for packages with between 11 and 25 assets (in 2015 it was packages with between six and 10 assets). The sales identification methodology does skew towards identifying sales of larger packages because if any asset changes hands, the package is considered sold. We do not account for a buyer cherry picking from large packages. However, contrary evidence of such cherry picking is that if buyers were regularly doing this, one would expect to see a much higher sales rate in the 51 to 100 asset range. We did see a higher rate in the 101 to 200 asset range (not shown) as a result of cherry picking.
Patent Sales by receipt date
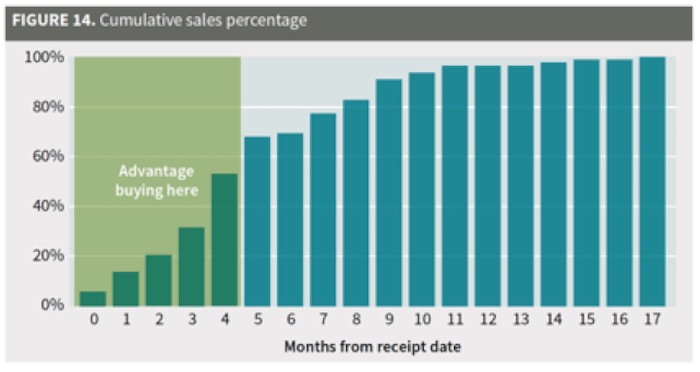
We also analyzed how quickly packages sell in order to estimate how much time buyers have to bid. We focused this analysis on packages which sold in order to calculate when buyers need to make a decision to avoid missing out on purchasing opportunities. The speed with which buyers are reviewing and purchasing packages continues to increase as buyers become more sophisticated and systematic. Figure 14 demonstrates that for 2015 listings, 80% of sales occurred within eight months (down from 11 months) of the receipt date of the package. We also observed that some buyers can move extremely fast, as is evident by over 50% of the packages selling within the first four months (up from 30%). Accelerated decision making continues to be an advantage.
Interestingly, the increase in buyer sophistication may have had an additional effect. The more automated a buying program becomes, the easier it is to re-examine packages if buying criteria changes. This could be why we have seen more sales of older packages, specifically 2013 listings, than in previous years. It is possible that we may start to observe a pattern of quick buying upon initial listings and then a second wave of sales two to three years later, although it may be some time before we have sufficient data to confirm or refute this hypothesis.
Patent Sales by EOU provided
This year, we continued to see an increased sales rate for packages with EOUs in the marketing material. While we occasionally hear buyers say that broker EOUs are unhelpful, the data indicates otherwise. Provision of an EOU not only boosted asking prices by 27%, but also increased the chance of sale. Packages with EOUs accounted for more than half (54%) of the sales of packages listed in 2015 or 2016. EOUs are a distinct advantage, considering that the likelihood of an EOU being provided in this dataset was only 36%. Putting these numbers in context, packages with EOUs are 50% more likely to sell, while packages without are 28% less likely to sell than an average package.
Impact of Alice on Patent Sales
Although we usually analyze sales using calendar years, the Alice ruling roughly coincides with the beginning of the 2015 market year, so we have used market years for this analysis (Figure 15). We took our 107 technology sub-categories and labeled each as either Alice-affected or non-Alice-affected. We identified 34 sub-categories – including most software, business processes, social networking and advertising – as Alice-affected. Additionally, within these categories, we identified seven technology sub-categories (business processes, e-commerce, payments, traded instruments and items with minimal hardware relating to payments) which we categorized as fintech.
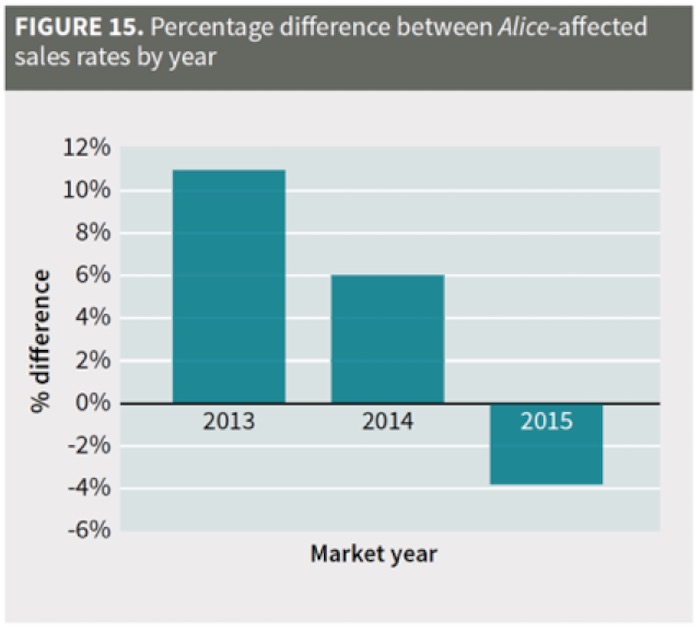
We compared the sales rates of the Alice-affected areas for the 2013, 2014, 2015 and 2016 market years (ie, June 1 of the previous year to May 31 of the market year) to the respective total sales rates. As noted, too few sample points for the 2016 market year were available to reach firm conclusions. However, there may be a rebound of sales of non-fintech, Alice-affected packages.
As Figure 15 shows, before the Alice decision, packages in Alice-affected categories were selling at above the market rate; then the rates dropped. This analysis reflects a change due to increased data availability – our previous 2015 market year analysis had initially shown that sales remained up post-Alice.
Meanwhile, for fintech patents alone, sales appear to have cratered post-Alice (down 40% compared to 2015 market year). Curiously, pricing for fintech packages lags and has not dropped relative to the abysmal sales rate.
Sellers
We now turn to sellers of patents for packages received between January 1, 2015 and May 31, 2016 (assignments were last checked on August 21, 2016). As expected and as illustrated by Figure 16, sales were mostly by operating companies: 66% (down from 71%). This drop was distributed fairly evenly over the other four categories. Missing from the sales data are private sales, which are not visible to us on the brokered market.
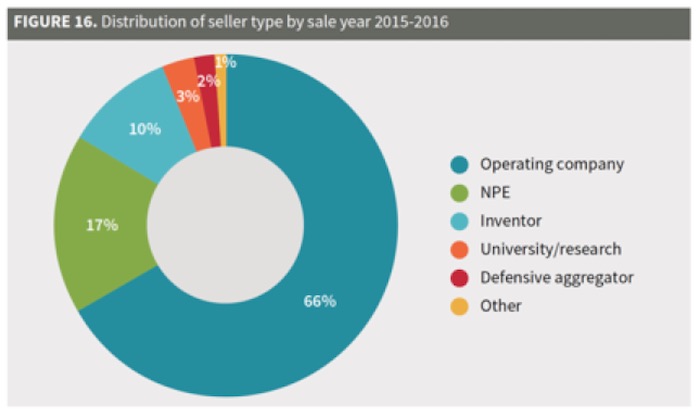
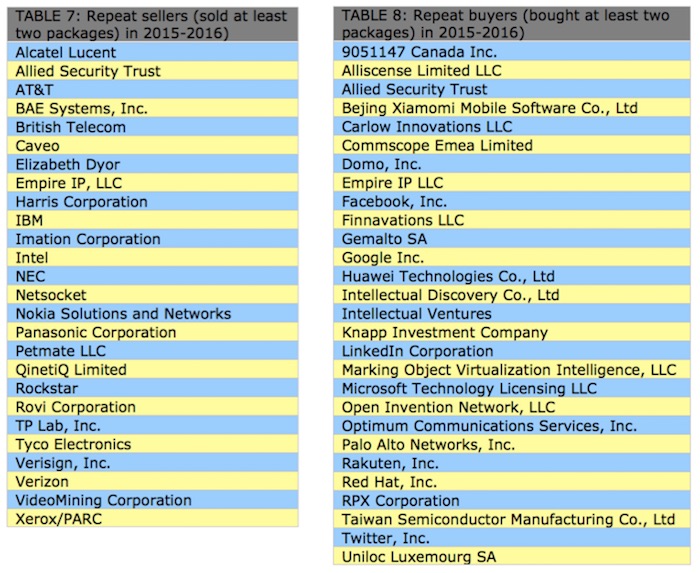
In terms of repeat sellers in this same period, 26 entities sold more than one package: 17 operating companies, five defensive aggregators, three NPEs and one inventor. These sales accounted for 36% of sold packages, 48% of sold assets and 50% of sold US- issued patents. As we discussed in an article on IV, having cross-licenses (or a license on transfer) would substantially reduce a company’s exposure to patents from regular sellers. The list of repeat sellers should be the focus for any cross-licensing strategy (Table 7).
Buyers
Surprisingly, for the first time, operating companies were the largest purchasers at 48% (up from 34%). NPE purchases fell to 34% (from 42%) and defensive aggregator purchases were also down, this time to 15% (from 21%) (Figure 17). IV’s buying dropped to only 13 packages (down from 40) and may be the primary reason for the fall in NPE purchases. This also raises concerns about how successful IV’s licensing and sales have been.
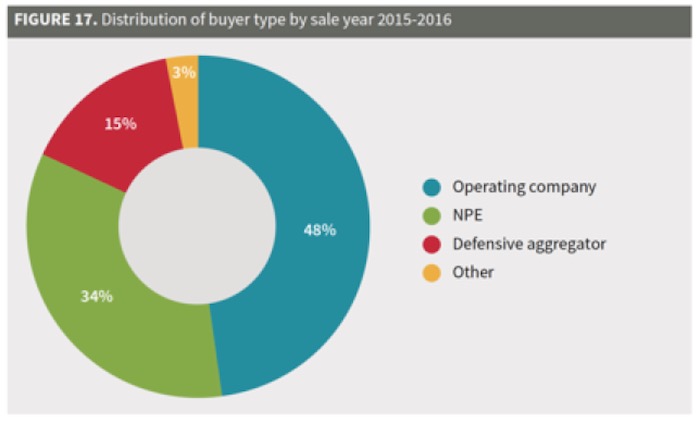
During this period, 123 buyers purchased 202 packages, with 28 buyers purchasing multiple packages. Repeat buyers purchased 53% of the packages sold (Table 8). The top three buyers (IV, RPX Corporation and AST) purchased only 21% (down from 36%). Additionally, RPX took over IV’s spot as top buyer, purchasing 11% of packages, 10% of assets and 12% of US-issued patents.
Like the rest of our analysis, these numbers include the brokered patent market only and do not include private purchases.
CLICK HERE to CONTINUE READING… In Part 5 of our 2016 Patent Market Report, we’ll analyze patent litigations and inter partes reviews. Are they more dangerous than you think?


![[Advertisement]](https://ipwatchdog.com/wp-content/uploads/2024/04/Patent-Litigation-Masters-2024-sidebar-early-bird-ends-Apr-21-last-chance-700x500-1.jpg)

![[Advertisement]](https://ipwatchdog.com/wp-content/uploads/2021/12/WEBINAR-336-x-280-px.png)
![[Advertisement]](https://ipwatchdog.com/wp-content/uploads/2021/12/2021-Patent-Practice-on-Demand-recorded-Feb-2021-336-x-280.jpg)
![[Advertisement]](https://ipwatchdog.com/wp-content/uploads/2021/12/Ad-4-The-Invent-Patent-System™.png)


Join the Discussion
4 comments so far.
Kent Richardson
April 26, 2017 11:37 amEric,
We can only report on what we can see. If you try to sell your patent and you don’t send it to us, we won’t see it. The data also clearly shows a market for inventions from small inventors. I suggest you focus on that segment, find a broker, and sell your inventions, if you so desire. We have a list of brokers on our website.
Kent
angry dude
April 23, 2017 09:25 amUntil an operating company buys patent(s) from an individual to shut down competitor(s) we do not have patent market in this country
angry dude
April 23, 2017 09:16 amIt’s like abolishing all real estate transactions below 1 mil and then claiming robust real estate market for trumps of this world.
Utterly ridiculous
Eric Berend
April 22, 2017 05:57 pm“Robust”?!! Precisely, for whom?
As an individual inventor and not also being a multi-millionaire: certainly, I realize there is a large market of larger firms with hundreds or thousands of patents in this IP space, whose concerns are a large part of the overall U.S. market. But this sort of article displays obdurate, perhaps even blithe, ignorance of our legitimate and original role as Constitutionally empowered.
IOW: you are talking over our heads. Yet more evidence demonstrating that this is a bifurcated market, with incumbent wealth unduly favored: this does not express the intent of the Founders.