

Your CEO: “Why are we spending so much on patents?” Your CFO: “Do we have a financial model for this spend?” The path forward isn’t clear. Now what? In this case study, we explore how we helped a high-technology, startup client model the value of their patent portfolio and patent strategy.
Patents provide value in different ways depending on how you use them
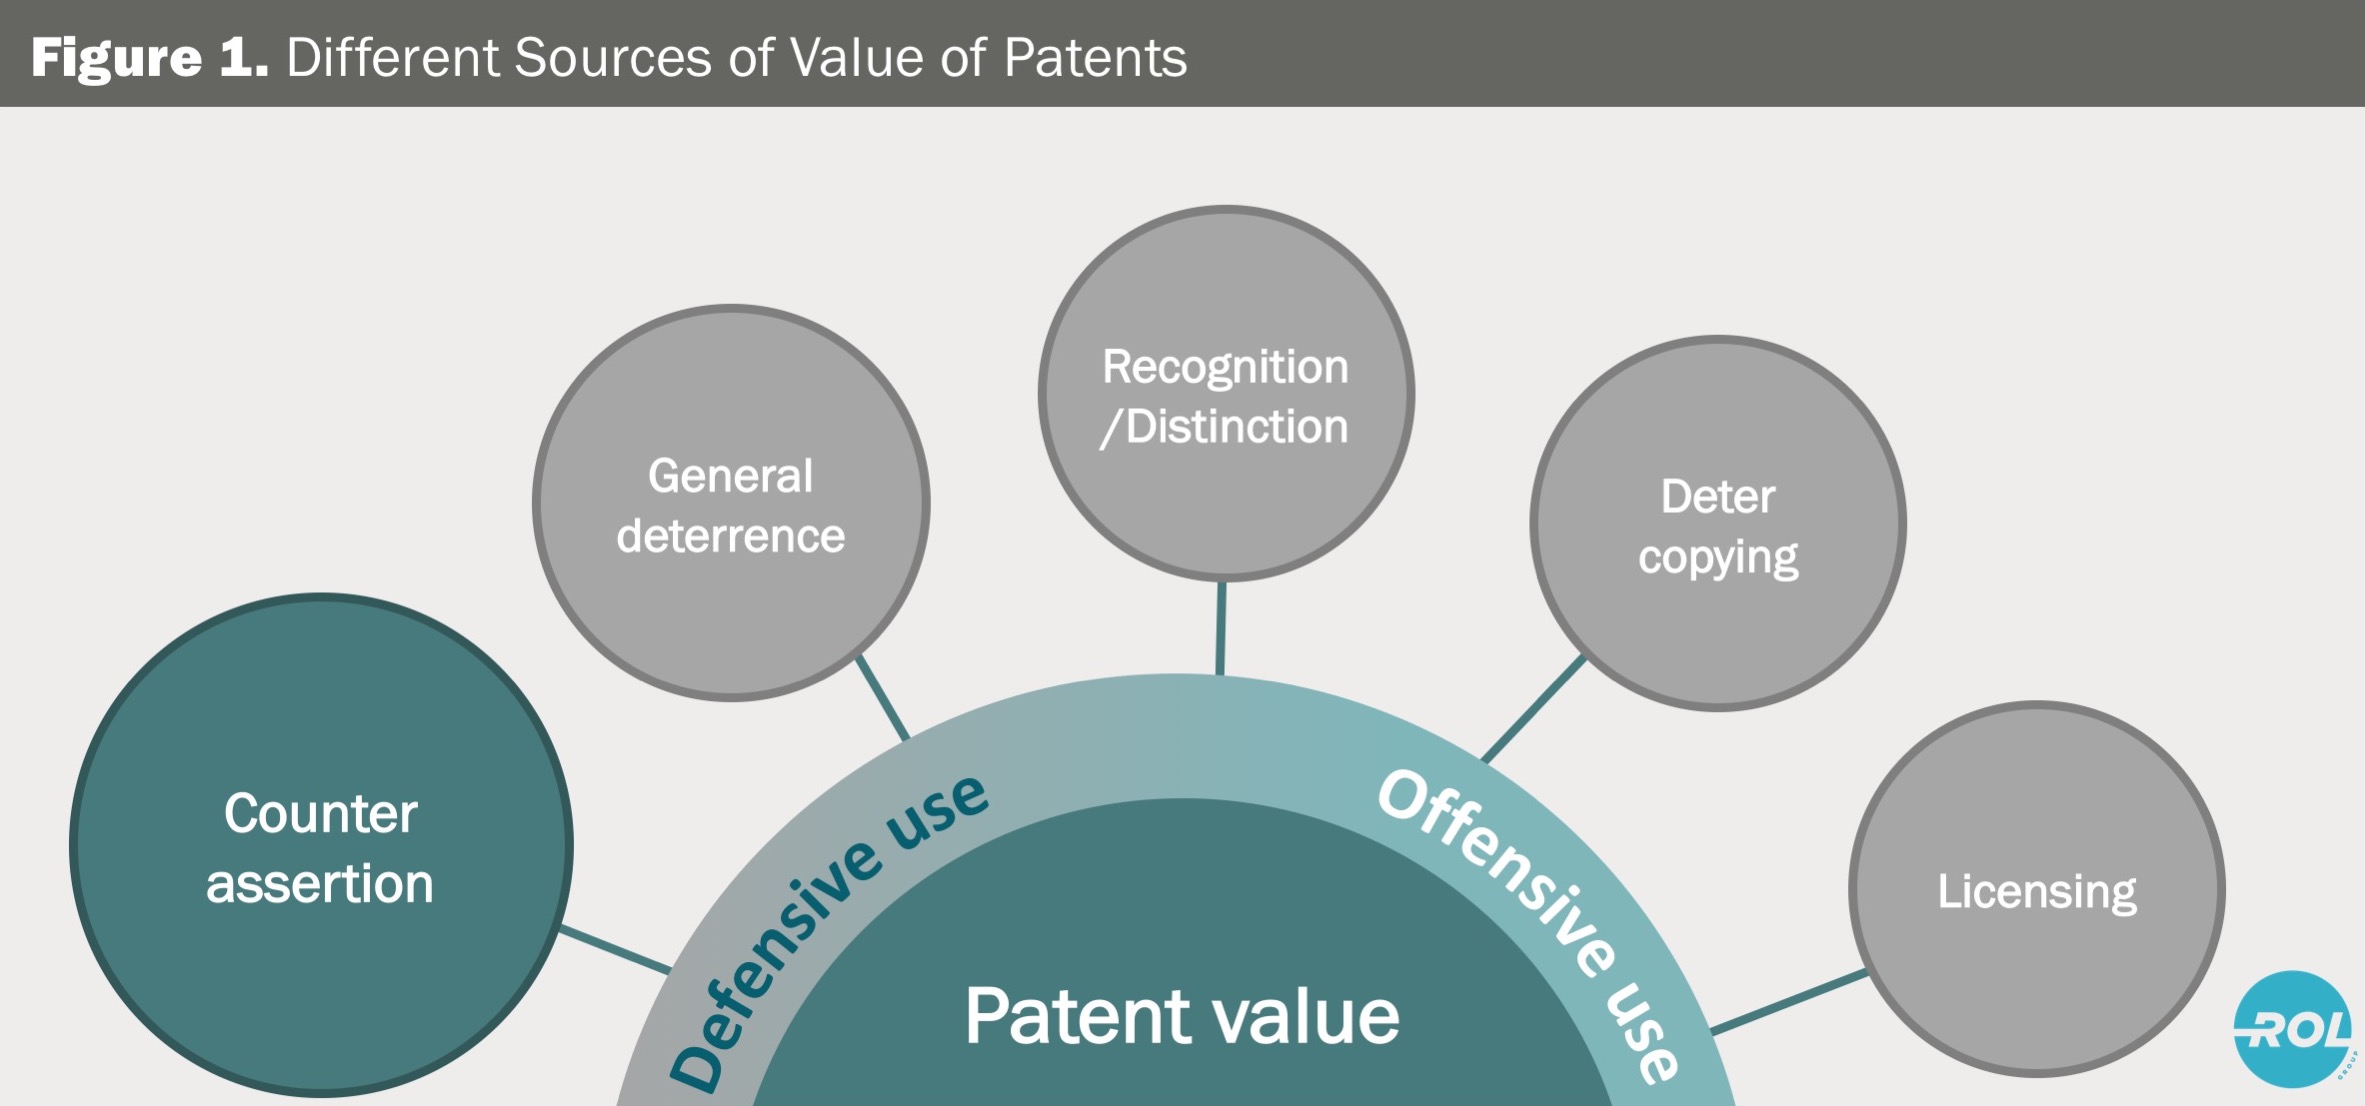
In one of our previous articles, we discussed how patents generate value for companies in several different ways. In this particular case, our client had been running a patent program for a few years and had built a patent portfolio for defensive purposes. Their goal had been to mitigate the risk of patent assertion from large companies in, and outside, of their ecosystem, see Figure 1.
The costs of the program were increasing, and the executives wanted a deeper understanding of the financial underpinnings of the patent strategy. The program costs were relatively easy to calculate. But calculating the expected return, or value, of the strategy and portfolio, was more of a challenge. We helped the client to assess the risk from their ecosystem and to model and value their current patent portfolio and patent strategy. In the end, the client used the model and the strategy to articulate the value of their program and helped the organization unite around the company’s patent strategy.
Our client had built their patent program primarily around a counter-assertion strategy, and their intended use of their patents was mainly for defensive purposes. Therefore, we focused on modeling the value of patent risk mitigation through counter-assertion. Note: we did not try to model the sources of value from the patent portfolio.
Although the client was not LinkedIn in this case, you can read how LinkedIn built a defensive/counter-assertion portfolio here.
How do you assess your patent risk?
First, we needed to understand our client’s patent risk. The client was vulnerable to patents of operating companies within their ecosystem, large corporate asserters outside of it, and NPEs. Their patent strategy focused on mitigating the bigger risks. Figures 2 and 3 illustrate the basis for analyzing and mitigating patent risks.
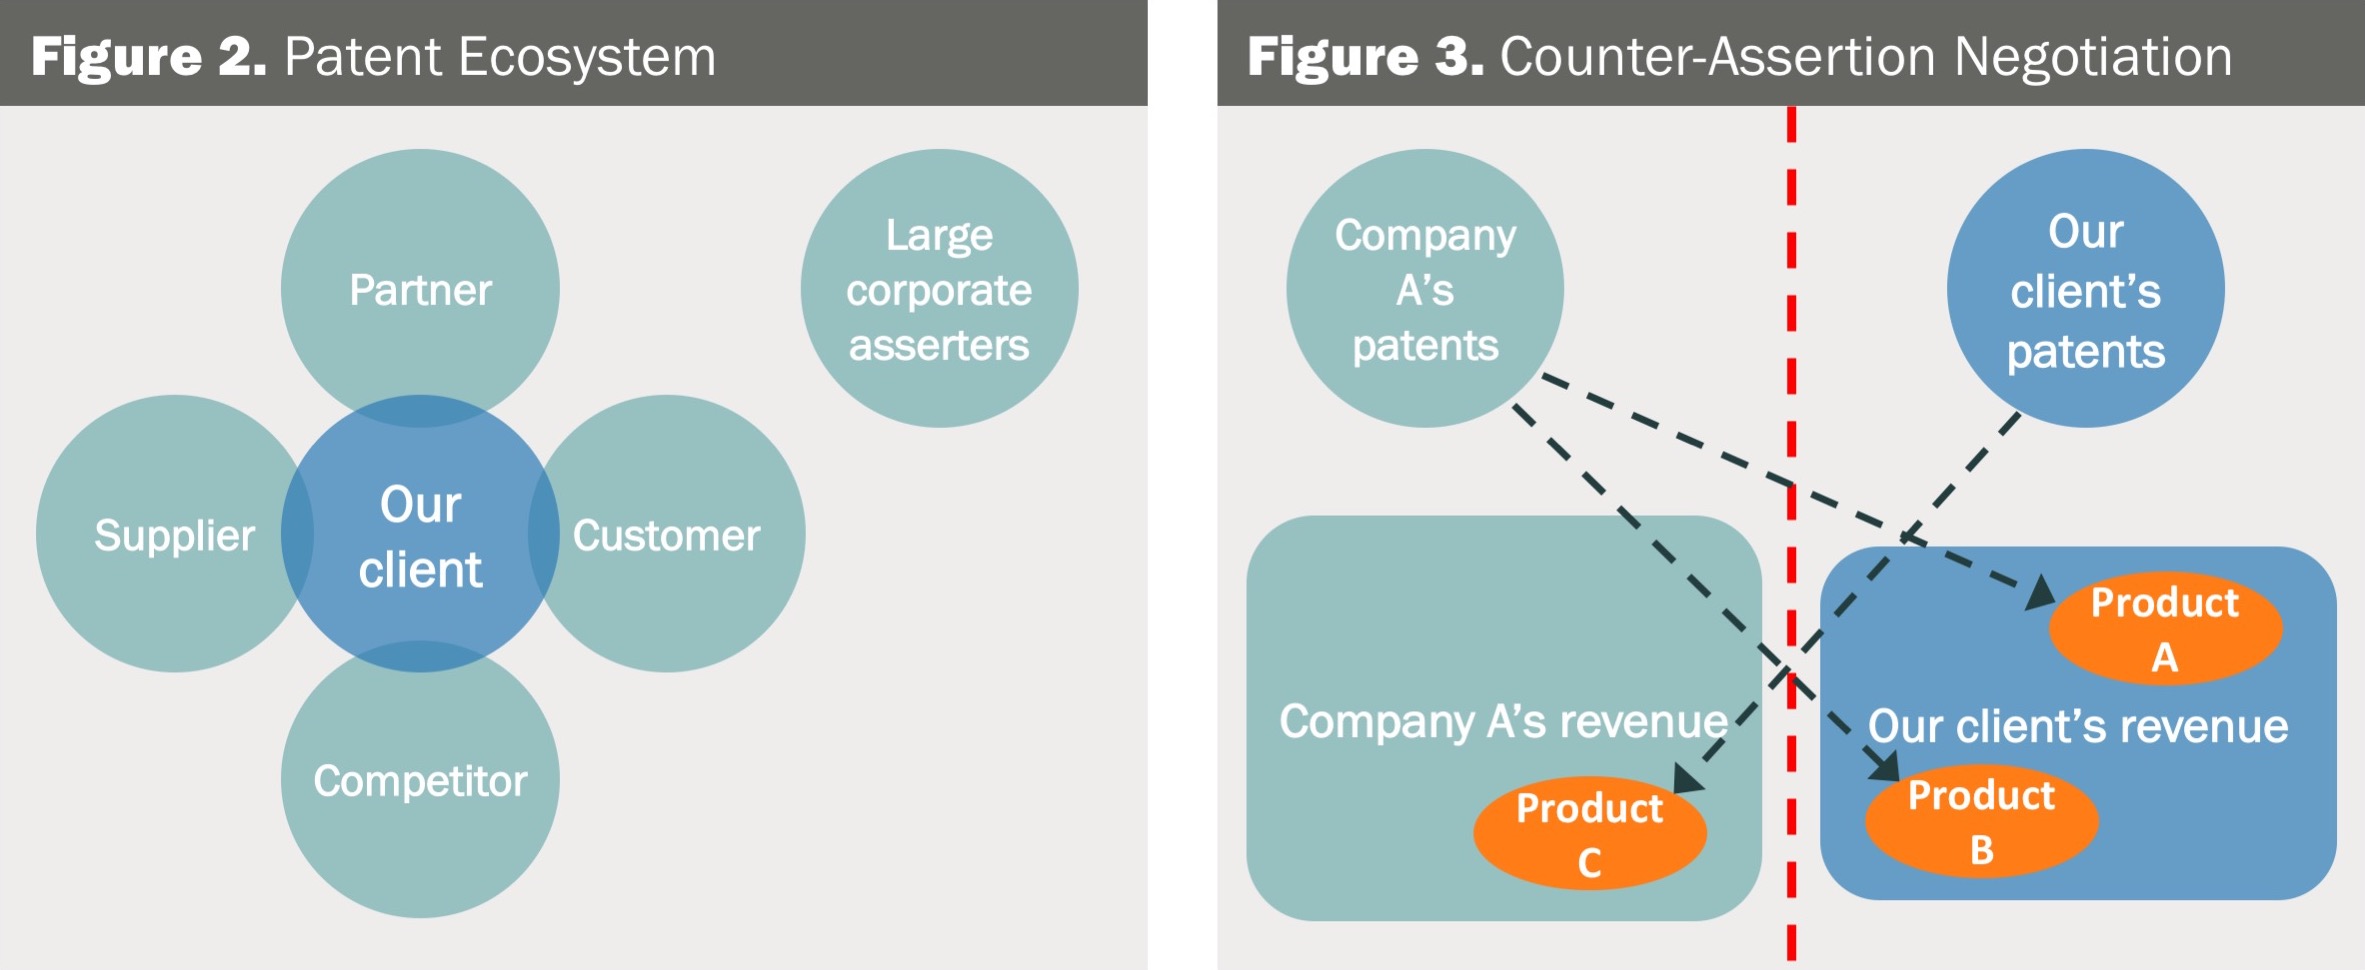
First, we had to identify likely patent asserters within and outside of our client’s ecosystem. Figure 2 illustrates a simplified view of an ecosystem. We reviewed all the client’s suppliers, customers, partners, and competitors for potential threats. We assigned each company a label of either high- or low-risk and went on to assess the specific risk of each high-risk company. Figure 3 illustrates how a counter-assertion by our client could change the dynamic in an assertion by Company A. Specifically, Company A’s revenues would be at risk due to their infringement of our client’s patents.
Modeling patent risk to determine expected value from your patents
After mapping the key sources of patent risk, the client wanted to approximate the counter-assertion potential of their portfolio. To do this, we looked into each high-risk company and asked the questions: what is the present value of the expected patent risk for this company? And how much could we reduce that risk by using our current patent portfolio for counter-assertion?
To answer the first question, we estimated the likelihood of an assertion as well as the cost and expected time frame of that assertion. This allowed us to list and compare all the companies based on expected risk.
To answer the second question, for this client, we used class codes as a proxy for potential patent infringement. This required analysis of the concentration and overlap of class codes of both the client and each high-risk company. Taking one example, our client’s portfolio was concentrated in five IPC class codes. Looking at OpCo 1 (see Table 1), we looked at the overlap of OpCo 1’s patents with our client’s five class codes to identify a higher chance of OpCo 1 infringing our client’s patents. The analysis was repeated in the other direction to look at the concentration of OpCo 1’s patents to assess our client’s risk of infringement. The class code assumptions are important and may need to be further tested depending on the situation. More sophisticated analyses can be performed for more refined results, e.g. claim-level analysis, machine learning-based similarity analysis, etc.
Table 1 illustrates how this can be applied. Take OpCo1 as an example. If we follow OpCo1’s row in Table 1 from left to right, you can see how we arrived at the value of using our client’s patent portfolio for counter-assertion against OpCo1.
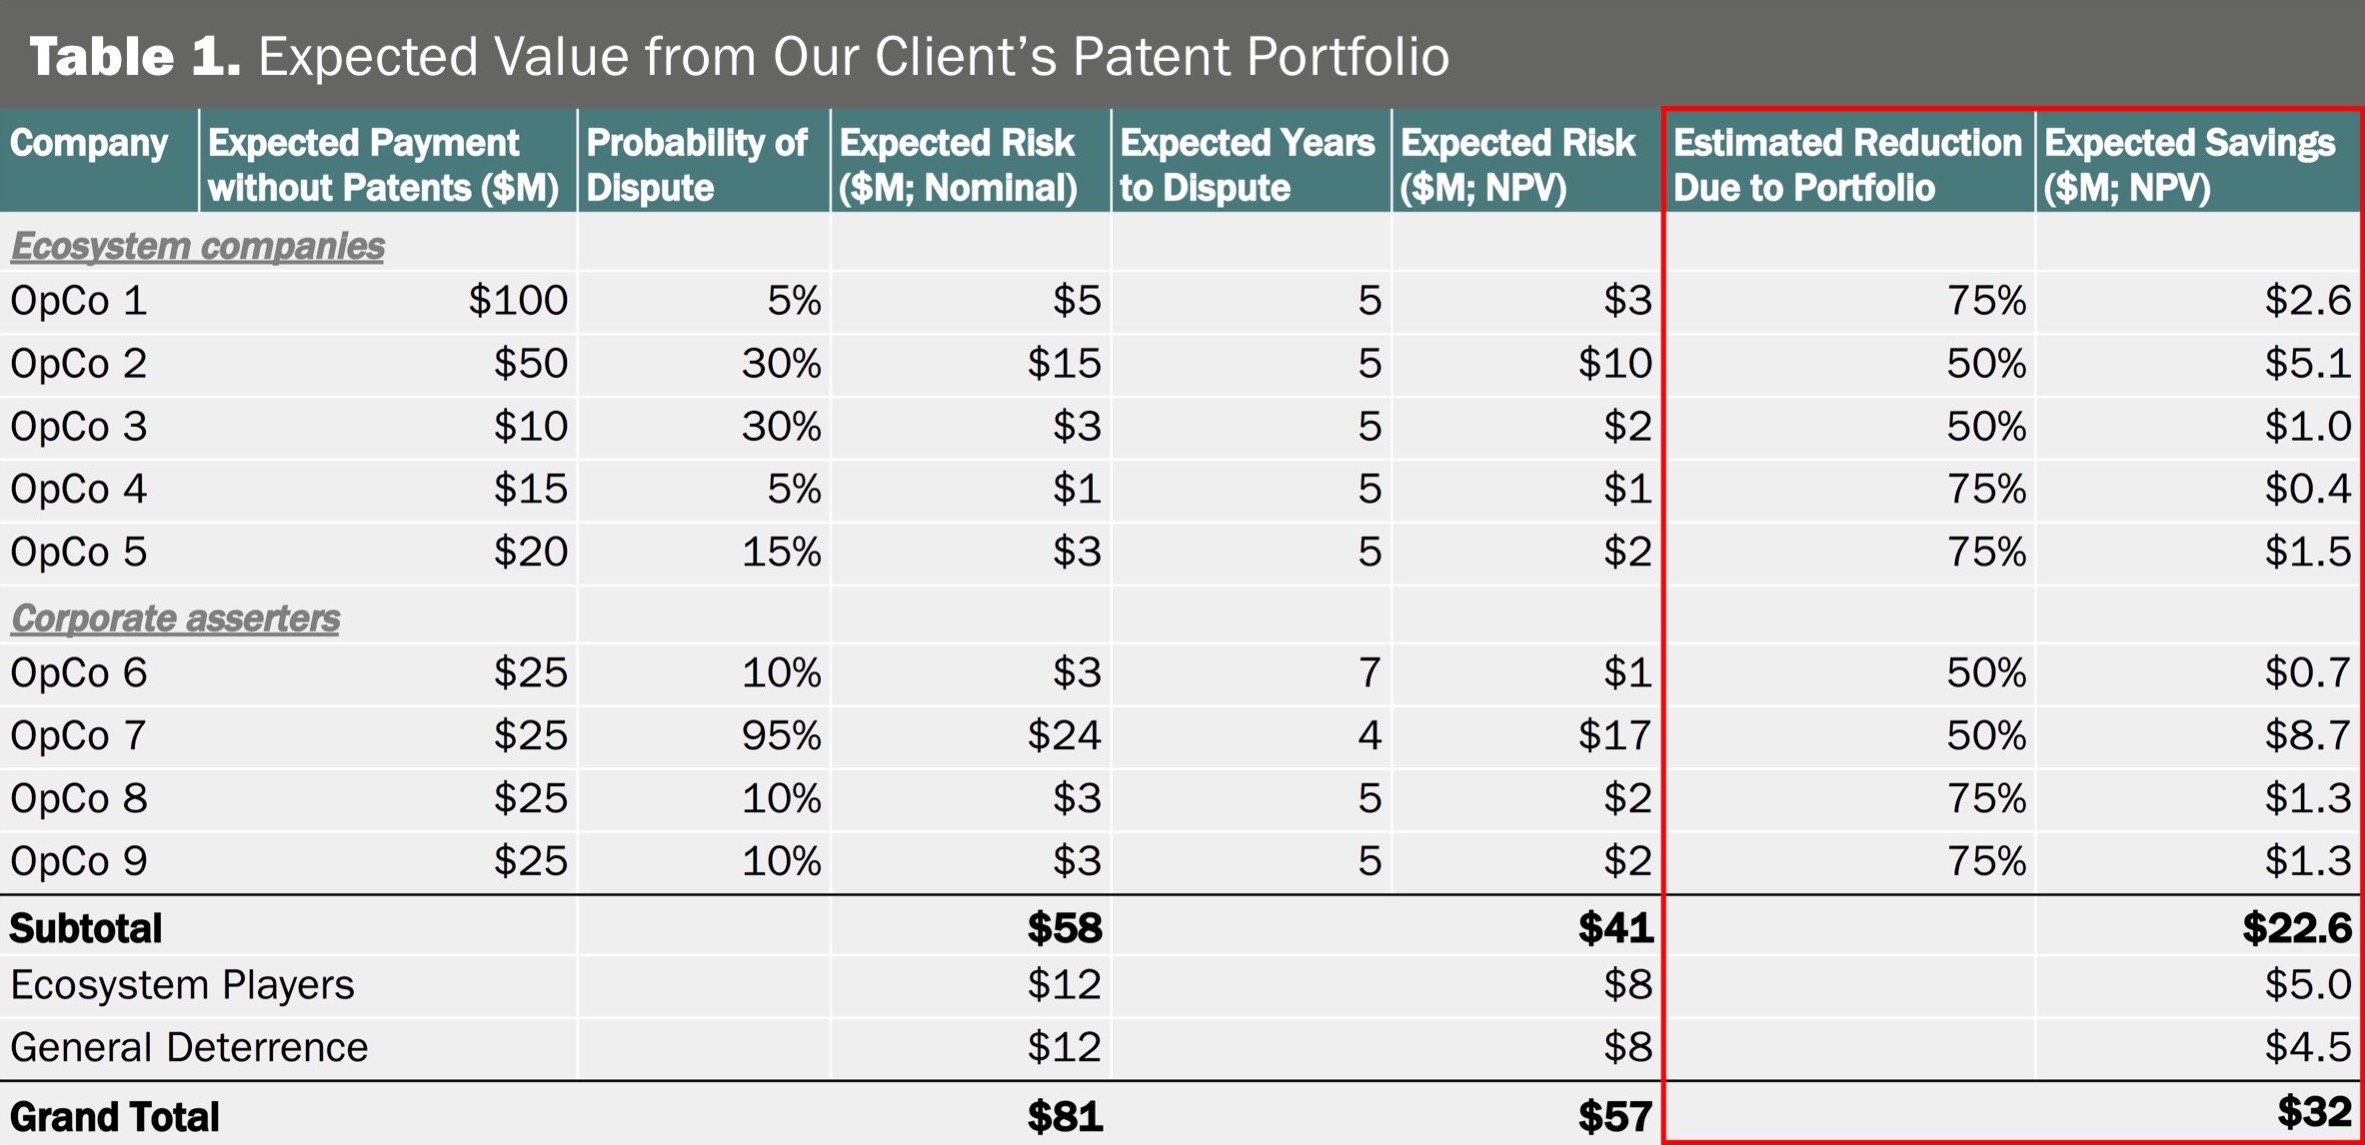
In the case that our client did not have any patents to use for counter-assertion, we estimated that they would have to pay $100 million in royalties if OpCo1 were to assert their patents. OpCo1 was considered a direct competitor and a threat to the core technologies of the client. The probability of an assertion was estimated at 5%, resulting in an expected risk of ($100 million x 5%) $5 million. We expected a dispute with OpCo1 to take place in 5 years, so we discounted the expected risk to get to a present value of $3 million. If OpCo1 were to/decided to assert their patents against our client, we assumed that our client’s patent portfolio could be used for counter-assertion and that it would reduce the expected payment by 75%. That 75% translated into expected savings of $2.6 million. The same calculation was repeated for all the high-risk companies we had identified in the previous phase (OpCo 1-9). The expected savings totaled $22.6 million.
We also estimated the savings from ecosystem companies. These are companies that have not been specifically identified but represent a threat because they operate in the same general ecosystem but do not pose as immediate a threat as the high-risk companies. We also estimated the value of the general deterrence of having a patent portfolio against others who may want to assert patents against our client. Combined, the ecosystem and general deterrence added $9.5 million in risk reduction value.
Conclusion
Using a model that examined both patent risk and expected risk reduction allowed the client’s IP department to put a number on the value of their efforts. In turn, this enabled the executive team to grasp the return on investment (ROI) from the patent strategy. Our client now had a tool to use for making decisions on how to mitigate patent risk and where to spend money to build their patent portfolio. The implications extend further into setting metrics and plan objectives to ensure that the patent strategy is on track.
All high-technology startups have patent risk, and they should assess that risk to gain insight into what strategies might provide them with the best-expected return from their patent strategy. Creating a model to articulate the value of your patent strategy will support your decision-making and help you communicate the value of different strategic options internally. It also provides clearer guidance as to what ROI your patent department is generating.


![[Advertisement]](https://ipwatchdog.com/wp-content/uploads/2024/04/Patent-Litigation-Masters-2024-sidebar-700x500-1.jpg)

![[Advertisement]](https://ipwatchdog.com/wp-content/uploads/2021/12/WEBINAR-336-x-280-px.png)
![[Advertisement]](https://ipwatchdog.com/wp-content/uploads/2021/12/2021-Patent-Practice-on-Demand-recorded-Feb-2021-336-x-280.jpg)
![[Advertisement]](https://ipwatchdog.com/wp-content/uploads/2021/12/Ad-4-The-Invent-Patent-System™.png)


Join the Discussion
One comment so far.
Eric Berend
August 22, 2017 09:54 amThe machinations of a post-injunction world. Since the true ‘teeth’ of U.S. patent rights were filed down to mere ‘nubs’ by eBay v. MercExchange, the ‘game’ afoot, has become reduced to mere, pathetic ‘MAD”*.
In this new Sport of Kings, earnest and genuine small entity inventors need not apply.
* Mutually Assured Destruction – otherwise known as a “Mexican standoff”; often found at a nuclear arsenal near you.