
 In an ideal world, your chance of getting a patent allowed is based on the merits of your patent application and independent of the largely random assignment of the patent examiner. As any patent attorney knows, however, this is not the case. Some examiners allow patents too easily and others seem predisposed against allowing any patents at all.
This ideal can be described as outcome consistency. The outcome of a patent application should be largely the same regardless of the assigned patent examiner. Outcome consistency is needed to ensure fairness. It is unfair for an applicant to be denied a patent for a worthy invention because it was assigned a hard examiner, and it is unfair to the public for a patent to be granted for an unworthy invention because it was assigned to an easy examiner. The lack of outcome consistency among patent examiners is a known issue that the USPTO is working on improving, and this article presents visualizations to help diagnose areas for improvement.
The patent application grant rate across the USPTO is 66% (computed as described here). One would expect that a distribution of examiner grant rates would follow a bell-like curve with (i) the average examiner having a grant rate of 66% and (ii) a reasonably small standard deviation such that most examiners are close to the average.
Here is the actual distribution of examiner grant rates across the USPTO (this is a weighted histogram according to the number of cases handled by an examiner with SPEs excluded):
USPTO:
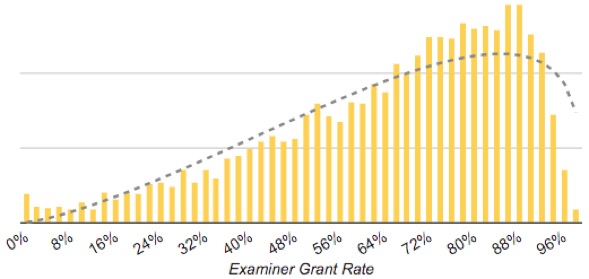
The distribution here is clearly far from ideal in that examiner grant rates run the full gamut from 0% to 100%. The standard deviation is 22%, and the dashed line is the closest bell-like curve (a beta distribution).
Possible reasons for the wide spread of grant rates include the following:
- Technology areas may have inherently different grant rates based on the difficulty of discovering an invention in a technology area.
- Examiners may have different difficulty levels.
Because of the hierarchical structure of the USPTO, the first possible reason is quite easy to investigate. The USPTO comprises three organizational levels: (i) 8 technical centers, (ii) 59 groups, and (iii) 568 art units. As you go down the hierarchy, the technology addressed is more specific. Accordingly, one would expect the examiner distributions for individual groups and art units to more closely resemble a bell-like curve with a smaller standard deviation.
Outcome Consistency Within Groups
I computed grant rate distributions for examiners of each of the 59 groups (I did not do so for art units because there is not enough data at only 10-20 examiners per art unit). Most groups had better outcome consistency than the USPTO as a whole but some were worse.
For comparison, here are distributions for Group 2630 (Digital and Optical Communications) with a standard deviation of 10% and Group 2620 (Selective Visual Display Systems) with a standard deviation of 23%:
Group 2630:

Group 2620:
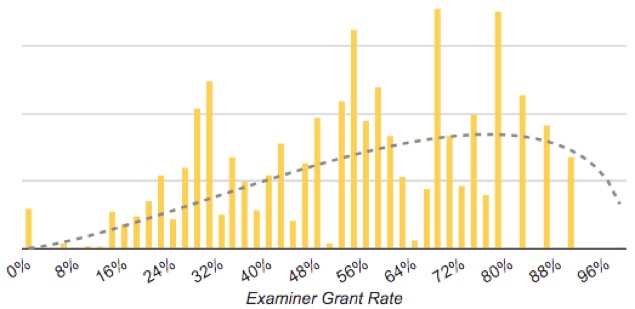
Because the distribution for Group 2630 is much closer to a bell curve and has a much smaller variance, we can conclude that Group 2630 is doing a much better job of achieving outcome consistency across examiners than Group 2620.
Why does Group 2620 have such poor outcome consistency? Since all of the patents examined by Group 2620 relate to Selective Visual Display Systems, diversity of technology seems to be an unlikely culprit. From my experience as a patent attorney and having worked with many different examiners, I would conclude that the poor outcome consistency is due to different difficulty levels of individual examiners.
Outcome Consistency Across Groups
Because different groups address different technologies, one would expect some variation of grant rates between different groups. One would also expect that groups that address similar technologies (e.g., groups in the same tech center) would have similar grant rates. The example above with groups 2620 and 2630, however, shows that this is not the case.
To view outcome consistency across groups, I computed the following distribution:
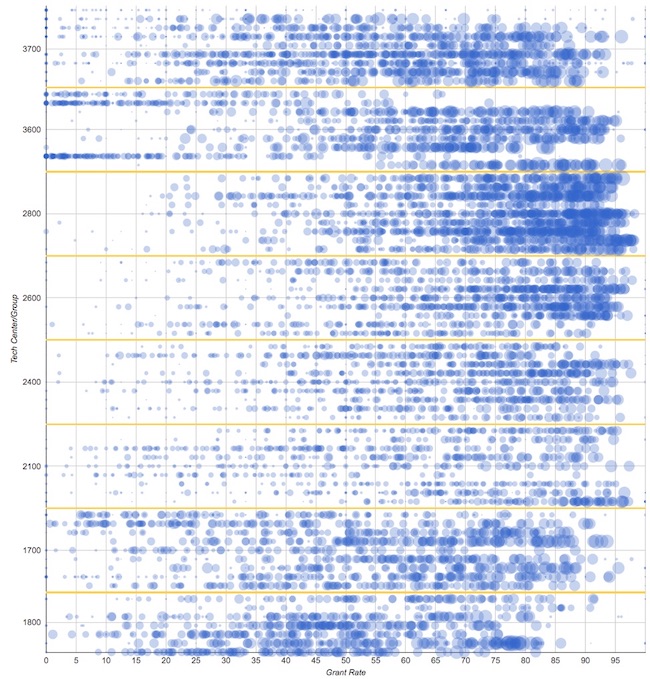
Each blue dot corresponds to an examiner, and the size of the dot corresponds to the number of cases handled by the examiner. The horizontal axis is grant rate, and the vertical axis is the group. Examiners in the same group are aligned horizontally so you can view the distribution of examiners in a group by scanning any horizontal line in the above distribution. Divisions between tech centers are indicated by the yellow lines. You can access an interactive version of the grant rate by group distribution, which allows you to click on a blue dot to see the details of an individual examiner.
As expected, the above distribution shows that some technology areas have, on average, higher grant rates than other technology areas. What I find most striking about the above distribution, however, is the large variation of examiner grant rates across all technology areas. While some groups (such as group 2630 discussed above) have lower variation of examiner grant rates, adjacent groups with similar technology (such as group 2620) do not share this lower variation, and accordingly there is a lack of outcome consistency across all technology areas of the USPTO.
If a patent applicant is fortunate enough to have his or her patent assigned to a group with low variation (such as group 2630) then, from that point forward, there is higher outcome consistency. If the applicant had used slightly different words in the claims, however, then the application could have been assigned to a different group with a very different grant rate and/or a much higher variability of grant rates.
In my practice, I have applications with similar technology where some applications get assigned to one of the business method arts units with very low grant rates (in Tech Center 3600) and others get assigned to more technical art units with much higher grant rates (in different tech centers, such as Tech Centers 2100, 2400, 2600). Accordingly, to get better results for my clients, I draft my claims in a manner to try to avoid getting classified into one of the business method art units.
Outcome consistency thus relates not only to the variability of examiners within a group, but also to the variability of examiners across the USPTO since applications with similar technology can be assigned to different groups and even to different tech centers.
Outcome Consistency and Patent Quality
The lack of outcome consistency is caused by at least two factors. First, the inconsistency in application classification can cause applications with similar technology to be assigned to different groups with very different grant rates. Second, in most groups, the variability of examiner grant rates is high. As a result, your chance of getting a patent granted depends in large part on the mostly random assignment of a patent examiner to your application.
Patent quality is paramount to the mission of the USPTO, and patent quality presumably includes making sure (i) that unworthy patents are not granted and (ii) that worthy patents are granted. When worthy patents are not granted, applicants are unfairly denied their patent rights. When unworthy patents are granted, the public may be harmed by unfair competitive advantages.
The data presented here may help identify areas for improving the second cause of outcome consistency identified above. This downloadable table shows the standard deviation of grant rates for each group in the USPTO. The groups from this table with the largest standard deviations of examiner grant rates may be candidates for review to find ways to decrease variability.
Image Source: Deposit Photos.
Charts provided by Author.
![[Advertisement]](https://ipwatchdog.com/wp-content/uploads/2024/04/Patent-Litigation-Masters-2024-sidebar-early-bird-ends-Apr-21-last-chance-700x500-1.jpg)

![[Advertisement]](https://ipwatchdog.com/wp-content/uploads/2021/12/WEBINAR-336-x-280-px.png)
![[Advertisement]](https://ipwatchdog.com/wp-content/uploads/2021/12/2021-Patent-Practice-on-Demand-recorded-Feb-2021-336-x-280.jpg)
![[Advertisement]](https://ipwatchdog.com/wp-content/uploads/2021/12/Ad-4-The-Invent-Patent-System™.png)


Join the Discussion
16 comments so far.
Don Quixote
December 27, 2018 11:26 pmThe talk here about relative “quality of inputs” is nonsense. The mechanism for corruption is clear from the earlier expose of the wildly different allowance rates for Art Units that prosecute almost, and frequently, THE VERY SAME inventive art. Arbitrarily decided outcomes are effectively provided by making certain GAU’s next to impossible, and other, similarly located, art units “easy street” in obtaining an issued patent.
By this mechanism of silo-ing the examiner cultures to specific art units/SPE’s, it then becomes easy to make a completely arbitrary and corrupt process, wherein “the right customer” gets sent to the easy art unit. The non-favored customer gets sent to the impossible art unit (except for pointlessly narrow claims). If such a powerful option is there, you can bet it will be used.
The wildly different cultures between technically similar art units is clear for anyone to see. The resulting opportunities for corruption, given the grotesque lack of transparency, are immense.
Anon
November 1, 2018 01:12 pmBenny,
Yet again, you “sound” in Efficient Infringer mantra.
The Quid Pro Quo and ANY taking of one without the commensurate — and equal part — of the bargain is something that should not be celebrated as you do here.
While there are limits (and oddly, the use remains low), the avenue of using Non-publication requests, LONG a staple advice of mine for client, helps alleviate the Efficient Infringer mantra that you display here.
Like another poster on another thread, I suggest that you check yourself for the anti-patent bias and realize that patent systems ARE good things and that protecting innovation through a patent system IS a good thing.
Arugula,
Your “voice” resonates with the views of one Ron Katznelson, who has supplied Amicus Briefs discussing the very asymmetry of risk that you note (in at least the i4i Supreme Court case).
John Wolfram
November 1, 2018 12:28 pmFascinating analysis. Really makes you wonder what you can do if you get stuck with one of those 0% allowance examiners in 2620. Perhaps file another application without a claim for priority and pray that the application is assigned to a decent examiner before the 4 month deadline passes?
Benny
November 1, 2018 12:02 pmNight @ 11,
You are off your rocker. Nothing in the notion of inflating a patent portfolio comes under the definition of “cheating”. Much of the inflated portfolios of large tech companies are junk patents (endless divisionals, features with no commercial viability, extremely narrow claims etc), so do not concern me.
You are also mixing terms. “Improving” (quality of patents) is not the same as “inflating” (quantity of patents). Furthermore, given my age it is wildly inaccurate to call me “boy”.
CP in DC
November 1, 2018 11:30 amI agree with Curious and gene, that examination is the problem.
If the USPTO receives a poorly written application (and there are many of them), a good examiner prevents a patent issuing from the poor application or allows a narrow claim for what is supported. That is the purpose of examination. Consistent output is achieved with consistent examination, not random examination. All applications must comply with the same laws, it’s the examiners doing the application that are inconsistent.
The most popular rejections are the easiest to perform 103 and 101. These rejections are mostly conclusory and examiners need only sit back and reject. The fact based rejections are difficult to perform and those are 112. One comment is that few applications are invalid under 112, read the Teva Copaxone cases, or several others in pharma. Plenty of of district court invalidity because that is where fact develop takes place. Examination should be making all applicable rejections, not just the easy ones to get a count and move on.
The data demonstrates that there is inconsistency in output. When poor patents issue, the public incurs the cost of correction through IPR or litigation or paying a license fee. When a good patent is held back, the applicant incurs the cost with an appeal. There is never a correction in examination.
Iancu is trying to fix IPR, I hope he spends some effort fixing examination.
Night Writer
November 1, 2018 11:22 am@6 Benny Much of the remaining 98% are corporations who want to pump up their patent portfolio
You are such a tool of the anti-patent people. The last time I talked about improving the patent portfolio of a large corporation was with an executive vice-president (number 2) who said their plan was to open a new research facility and increase R&D money.
But little Benny boy wants to portray it as a bunch of cheats.
Benny
November 1, 2018 10:18 amArugula,
“But note that an unworthy patent has opportunities to be invalidated after the issuance”
Do a quick check how much “opportunity to be invalidated” costs and check if that equates to “harmed by unfair competitive advantage”.
In my book, being 300K out of pocket because a lazy or incompetent examiner can’t get his or her act together = “harmed”.
Also, the potentially valuable advance in a denied patent application is NOT lost. It is public after 18 months. The ROI may be lost, but not the invention.
Arugula
November 1, 2018 09:44 amJeff, thanks for the good work. Very interesting statistics.
“When worthy patents are not granted, applicants are unfairly denied their patent rights. When unworthy patents are granted, the public may be harmed by unfair competitive advantages.”
But note that an unworthy patent has opportunities to be invalidated after the issuance – IPR or litigation. A good invention that is never issued as a patent is a potentially valuable advance that is lost. This suggests the policy should be to err on the side of issuing patents, rather than not issuing.
gene
November 1, 2018 09:35 am“The most likely cause of outcome inconsistency is patent application inconsistency.”
This is irrelevant to the analysis presented because patent application inconsistency very likely follows a bell curve due to the randomness of inputs. Patent examiner behavior, however, is not a random input. If patent examiner behavior was fair and objective, the outputs would also have a bell curve shape.
Ternary
November 1, 2018 09:30 amBenny, The 2% is a “guesstimate” of new independent inventors who have filed 4 or fewer US patent applications (to qualify for “micro entity” status). There is a group of independent inventors who have filed more than 4 US applications, who are captured as being a “small entity.” Old USPTO data from 2015 showed about 289,000 patent applications filed from US origin. Based on that about 6-7% of all US applications in 2015 were by independent inventors. Lack of published USPTO data seems to suggest that this number has further diminished. The “independent inventor” is a typical US political phenomenon. Politicians with their new laws/bills always claim to promote/protect this entrepreneurial inventor. Objective data that show that the independent inventor is basically disappearing from the US patent scene would be very unwelcome news.
The most current USPTO data only shows percentages of large, small and micro entities.
Benny
November 1, 2018 05:38 amTernary @2, ” It seems to be an inherent assumption that “obtaining a patent” at any cost is what inventors desire. ”
It is not what inventors desire. It is what applicants desire. As you mentioned yourself in your next post, only about 2% of applicants are independent inventors. Much of the remaining 98% are corporations who want to pump up their patent portfolio, management can count patents but don’t understand the claims. Inconsistency works, in part, in their favour – file reams of applications, and some of them are bound to land on the desk of an examiner with a mild headache on a Friday afternoon, leaving the rest of us with the bill for picking up the mess created. Think it hasn’t happened to us? Think again.
Curious
October 31, 2018 09:42 pmThe most likely cause of outcome inconsistency is patent application inconsistency. Better patent applications should have a higher grant rate.
No — it is the Examiners. Just look at business method group in 3600, which all have very low allowance rates. From my experience, the attorneys drafting those applications are drafting the applications that are getting the high rates of allowance in 2100 and 2400. The vast majority of them involves software. However, if your application has the misfortune of being classified in TC 3600, the odds of your application being allowed drops significantly regardless of the attorney drafting it.
Ternary
October 31, 2018 09:24 pmPro Say, My initial reaction was “there cannot be that many who give up.” But you have a point. According to USPTO 2017 PAR statistics: (https://www.uspto.gov/sites/default/files/documents/USPTOFY17PAR.pdf) in 2017 373,093 cases were allowed and a stunning 302,466 cases were abandoned.
Another astonishing statistic in 2017 PAR is that a mere 4% of US Applications are filed by micro-entities. Considering the fact that Higher Education Institutions are allowed to file as micro-entities, it seems to indicate that there is only a very small number of new independent inventors. Perhaps at most around 6,000, if even that. (assuming that new independent inventors file as micro-entity and form perhaps 2% of total US based applications, which is probably around 320,000). The 2015 USPTO statistics show that in 2015 there were over 19,000 patents issued to independent or individual inventors.
It is extremely hard to find good recent statistics about patents, patent applications and independent inventors. When statistic categories are changed, one may assume that there is an underlying political reason to make comparison with the past harder. It may be that the outlook for independent inventors is much rosier than I am assuming. But the indications are not good for independent inventors.
Pro Say
October 31, 2018 04:30 pmVery interesting data Jeff. Nice job.
NS II’s viewpoint is interesting, though — given that the vast majority of patent apps are written by well-informed, experienced patent attorneys and patent agents — I don’t see app / patent quality as being a material factor in the data inputs.
Also, I believe that if fewer companies / entities abandoned their apps (for whatever reason(s)), the allowance rates would increase for all art groups.
Many folks give up too soon.
Ternary
October 31, 2018 02:51 pmNS II and Jeff. The quality requirement of the patent application is fairly well defined in the written description requirement. I see relatively few applications being invalidated on 112 after being issued as patents. Usually patent ineligibility and obviousness are the main reasons for post-issuance invalidation.
The vague and arbitrary definition of what is obvious in hindsight (KSR) is a system property that has to be resolved by the system in the system. It is a huge flaw in what is assumed to be a rational process. There is relatively little that an applicant can do about that. In fact, almost any inventor will tell you that obviousness rejections are completely irrational and incomprehensible from their perspective. “That is not how it is done” is almost a classical response to combining prior art in a 103 by an Examiner.
As an independent inventor, I would like to see an application fail or being rejected in an earliest stage of prosecution. My interest is not to have an application sneak through the system to become a patent that is worthless. It seems to be an inherent assumption that “obtaining a patent” at any cost is what inventors desire. For most of us, it is certainly not the case.
Non Sequitur II
October 31, 2018 12:18 pmYou cannot evaluate the quality of a system without considering the quality of its inputs. The most likely cause of outcome inconsistency is patent application inconsistency. Better patent applications should have a higher grant rate. In theory, the grant rate distribution should match the allowable patent application distribution. However, there is no way to measure patent application quality so there is no way to know if the inconsistency is caused by the examiners or the applications. Because patent practitioners (including pro se) are not equivalent, a large variability in patent application quality would not be surprising.