 The text of patent applications is a rich source of data which, indirectly, encodes trends in history, economics, science, and technology (and to some extent, changes in patent law). In this study, trends in the occurrences of words appearing in the titles of patents and patent applications are depicted as an animated word cloud evolving over 40 years (video). Principal component analysis reveals a strong, overarching, 40-year long shift away from words associated with material subject matter and toward the domain of information.
To uncover and visualize underlying trends in the subject matter of patents, we analyzed four decades of data from the USPTO PAIR database, from 1977 through 2016, inclusive. Extracting the title of each granted patent or application and the date it was filed yields 493 megabytes of data, comprising 7.7 million records and 59.8 million words.
We divide the words of each title into 480 monthly bins and exclude both conventional stopwords and a patent-specific list of stopwords. Excluding stopwords amplifies the importance of words with greater semantic content in the analysis.
Counting the remaining words as unigrams generates monthly lists, which are sorted by frequency in decreasing order. Taking the 50 most common words in each single month and merging into one list yields a list of words, all of which were common in at least one month. Then, we count the number of months in which each unique word appeared. The top 63 words from that list are the focus of the visualization. Their monthly counts are smoothed by a seven-month moving average, sorted alphabetically, and transformed into images. By means of HTML, each word is displayed in a font size proportional to its frequency. Higher frequency words are larger than lower frequency ones. For each year, the June frame is extracted and sequenced into a video at the rate of one frame per second. Thus, 40 seconds of video represent the 40 years of calendar time in the data.
The pronounced shift from blue words to orange words in the animated visualization suggests a major trend in the last 40 years away from patents related to materials and machines (as signified by words such as “compounds,” “machine,” and “valve”) and toward patents related to information (as signified by words such as “display,” “image,” and “processing”). For example, we can see a specific, clear instance this trend by plotting the frequencies of the words “combustion” and “communication” simultaneously against the date axis (Figure 1).

Figure 1. Frequencies of “combustion” and “communication” in patent titles over time.
Applying the machine learning technique of principal component analysis (PCA) generates a more comprehensive and objective model of this 40-year long trend. PCA is an example of an “unsupervised” machine learning technique, i.e., it does not require explicit labels in a training dataset to guide it to a pattern. The power of the PCA algorithm is to automatically identify the most significant “components” of a data set, a component being a set of weights, one for each variable. In this case, the variables are the frequencies of each of the 63 target words, month by month. The leading component will model the largest amount of variation, correlated through time, among the various words. The second component will model a lesser amount of variation, and so on. Generally speaking, when correlations exist in a dataset of many variables, a small set of the components found by PCA can explain or model a disproportionately large fraction of the total variability in the data. Hence, PCA is often referred to as a means of pattern recognition, where the leading components are the recognized patterns.
In this case, notably, the first component captures 72% of the variance in the data. The first component is a strong signal and well separated from the second component, which accounts for 16% of the variance. The first component assigns positive weights to 29 of the 63 target words (those that increase over time) and negative weights to the remaining 34 words. Inspecting the words with the largest weights (both positive and negative) reveals a remarkable consistency in the meanings and associations of the words (Figure 2).
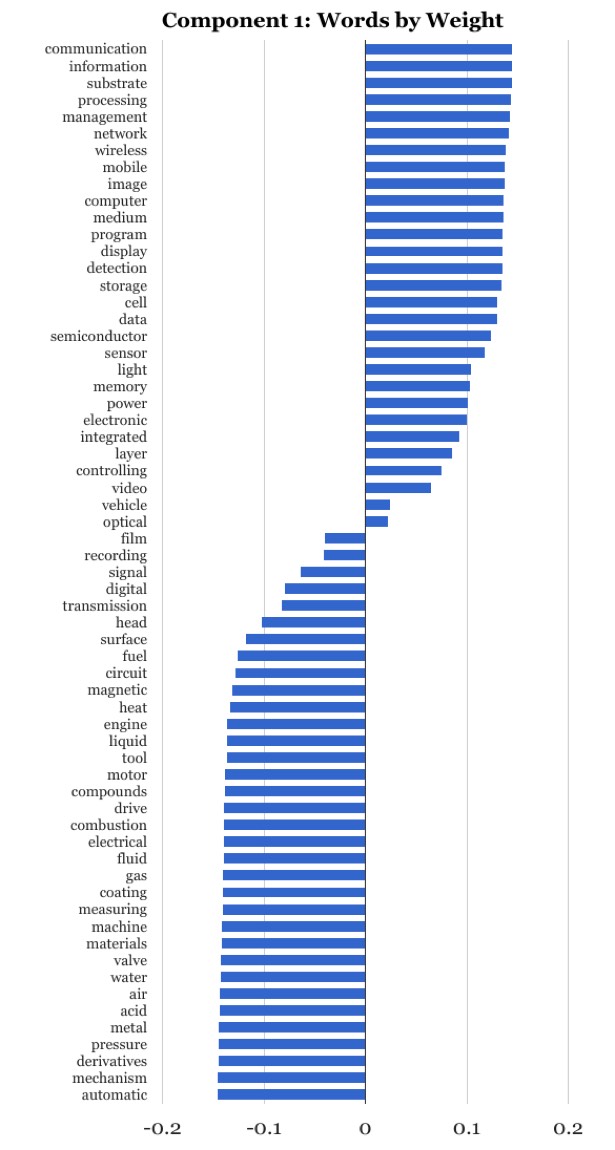
Figure 2. The leading principal component with its words sorted by weight.
To see the big picture contours of the leading principal component in the data, we plot the full list of 63 words, sized in proportion to their frequencies in a single month, and colored according to their numerical weights in the leading principal component. Figures 3 and 4 visualize the data for January 1977 and December 2016, respectively. Positive weights are shaded orange while negative weights are in blue. Weights close to zero are gray.
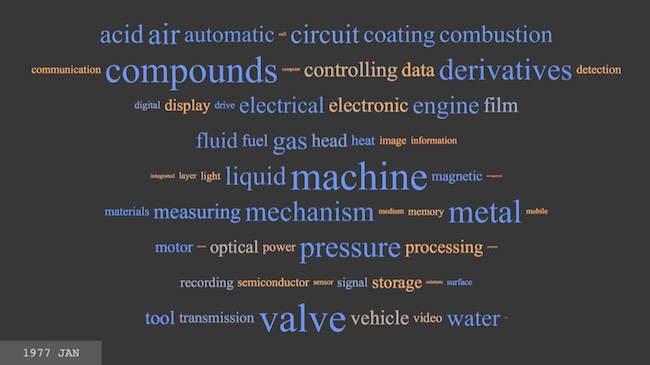
Figure 3. All 63 target words colored according to their weights in the leading principal component (orange for positive, blue for negative, gray when near zero). Size is proportional to the observed frequency in January 1977.
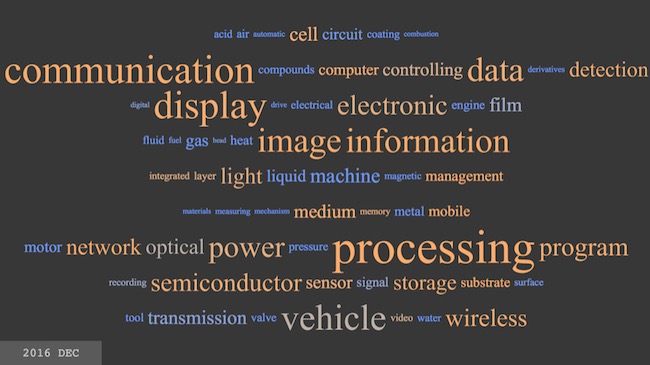
Figure 4. All 63 target words colored according to their weights in the leading principal component (orange for positive, blue for negative, gray when near zero). Size is proportional to the observed frequency in December 2016.ready to use –
A few words, notably “optical” and “vehicle,” followed by “film” and “recording,” have weights close to zero and appear in shades of gray. A low absolute value of a weight signifies that the change in frequency of the associated word, through time, is relatively uncorrelated with the rest of the pattern captured by the leading principal component.
To reiterate, the single largest trend (72% of the variance) involves a quasi-steady, correlated increase over 40 years of nearly half the target words, paired with a correlated counter-trend of decrease in the remaining words, while a handful of words change in an uncorrelated manner. We can plot the pattern captured by component 1 as a trend line (Figure 5).
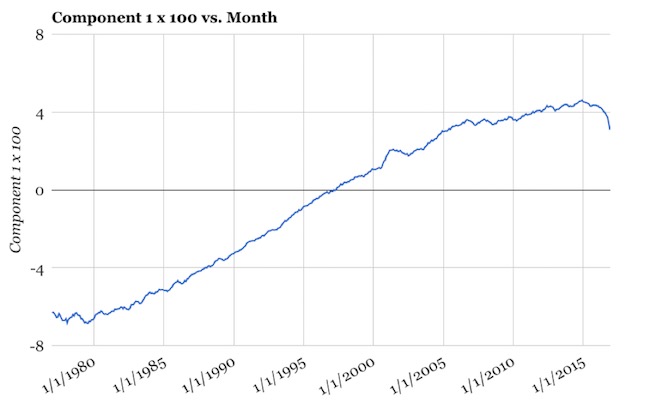
Figure 5. A time-series plot of component 1.
Beyond capturing and visualizing trends, practical applications for the computational analysis of patent text abound, including art unit prediction (and hence, the prediction of prosecution duration an allowance rate), subject matter classification, semantic search, novelty analysis, eligibility/101 prediction, and structural consistency/robustness analysis. Applications within the larger patent system are not limited to patent text alone. The text of examiners’ remarks in office actions is also a fertile field for investigation. As a discipline, the commercial significance of data science techniques in the intellectual property professions is only just dawning and the future is undoubtedly bright.

![[IPWatchdog Logo]](https://ipwatchdog.com/wp-content/themes/IPWatchdog%20-%202023/assets/images/temp/logo-small@2x.png)

![[Advertisement]](https://ipwatchdog.com/wp-content/uploads/2024/04/Artificial-Intelligence-2024-REPLAY-sidebar-700x500-corrected.jpg)
![[Advertisement]](https://ipwatchdog.com/wp-content/uploads/2024/04/UnitedLex-May-2-2024-sidebar-700x500-1.jpg)
![[Advertisement]](https://ipwatchdog.com/wp-content/uploads/2024/04/Patent-Litigation-Masters-2024-sidebar-700x500-1.jpg)

![[Advertisement]](https://ipwatchdog.com/wp-content/uploads/2021/12/WEBINAR-336-x-280-px.png)
![[Advertisement]](https://ipwatchdog.com/wp-content/uploads/2021/12/2021-Patent-Practice-on-Demand-recorded-Feb-2021-336-x-280.jpg)
![[Advertisement]](https://ipwatchdog.com/wp-content/uploads/2021/12/Ad-4-The-Invent-Patent-System™.png)




Join the Discussion
One comment so far.
Curious
April 25, 2017 12:33 pmToo bad the Federal Circuit is stuck in the 1970s and fails to appreciate that the new economy is based upon these so-called “abstract ideas.”