
“This year, we are seeing significantly more medical device packages and some moderate increases in imaging packages.”
This is part 2 of a 6-part series on Richardson Oliver Insights’ 2018 Patent Market Report.
In our first article examining the 2018 patent market, we provided an overview of the data and found that prices were stabilizing across listings, buying and selling programs were becoming more streamlined, and there were more transactions overall. This trend extends to “patent packages” as well.
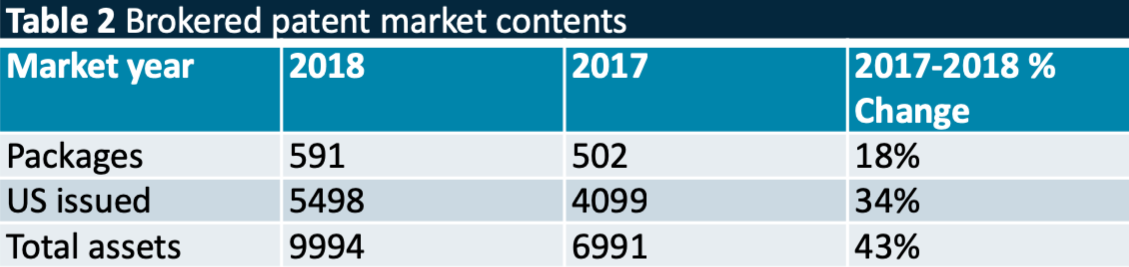
At 591 packages (502 last year), listings have increased by 17.7%. The only year in which we saw more listings was the 2016 market. If the assets from Provenance Asset Group were included in these numbers, the numbers would show an all-time high. The number of total assets and of U.S.-issued patents also increased (see Table 2). We have benchmarked our deal flow with that of other large corporations and defensive aggregators and have found that the number of brokered packages we received is generally similar, so we are confident that our numbers reflect the market. Compared to prior years, the total number of U.S.-issued assets listed in packages increased twice as fast as the number of packages listed. Notably though, the total number of assets listed increased even more than the U.S.-issued assets. This signifies the continued importance of international assets and an elevated level of focus on elements of a package other than U.S.-issued assets. But, U.S.-issued assets are still the focus in most listings (see Figure 4). While we limit the types of package included in this dataset to the more common types (e.g. quasi-public/brokered packages containing 200 or fewer assets), we also track larger bulk deals and private deals.

From Software to Solar, Packages Remain Diverse
Overall, the market continues to provide packages with applicability to a diverse range of technologies, products and focus companies. With a healthy number of varied packages, there are assets available to fill business needs in almost any high-tech category. When we receive a package, we use the package materials, and any asset highlighted by the seller, to categorize it according to our taxonomy of technical areas. We have developed a two-tiered classification taxonomy with 18 general technical categories and 108 sub-categories, which we continue to modify as new technologies come onto the brokered market.
 As seen in Figure 5, the distribution of general technologies continues to skew towards software. There has also been significant growth within certain software technologies, including increased listings relating to Internet of Things, internet-scale data management, and content and consumer software such as video and image processing. Additionally, for the first time, the “other” category has now overtaken hardware as the second most common category. This is due to increases in listings in a variety of different areas and increased diversity in technologies listed. Last year, there was a rise in listings in the energy and automotive sectors, including solar-power, charging, autonomous driving, and connected cars, and these areas have continued to be popular. This year, we are seeing significantly more medical device packages and some moderate increases in imaging packages.
 The word cloud in Figure 6 provides another way to visualize the focus of the brokered patent market. The relative size of the words highlights the hot companies, technologies and products identified in the summaries of evidence of use (EOUs) provided as marketing material from the broker or seller of the packages. Focusing on the word cloud, one can get a sense of how most packages were marketed in the 2018 market year. It should come as no surprise that the biggest technology companies (e.g. Microsoft, Apple, Samsung, and Google) continue to be the favorite targets of patent sellers’ EOUs. For the second straight year we have seen an increase in references to Facebook, which is now as prevalent in EOUs as the others. Additionally, we are seeing more references to Chinese companies like Huawei and ZTE, thereby highlighting the importance of these companies globally. Finally, there is an increase in the prominence of the terms “3GPP” and “LTE”; we have seen twice as many wireless infrastructure and standards listings as last year.
Single Asset Packages Come in On Top
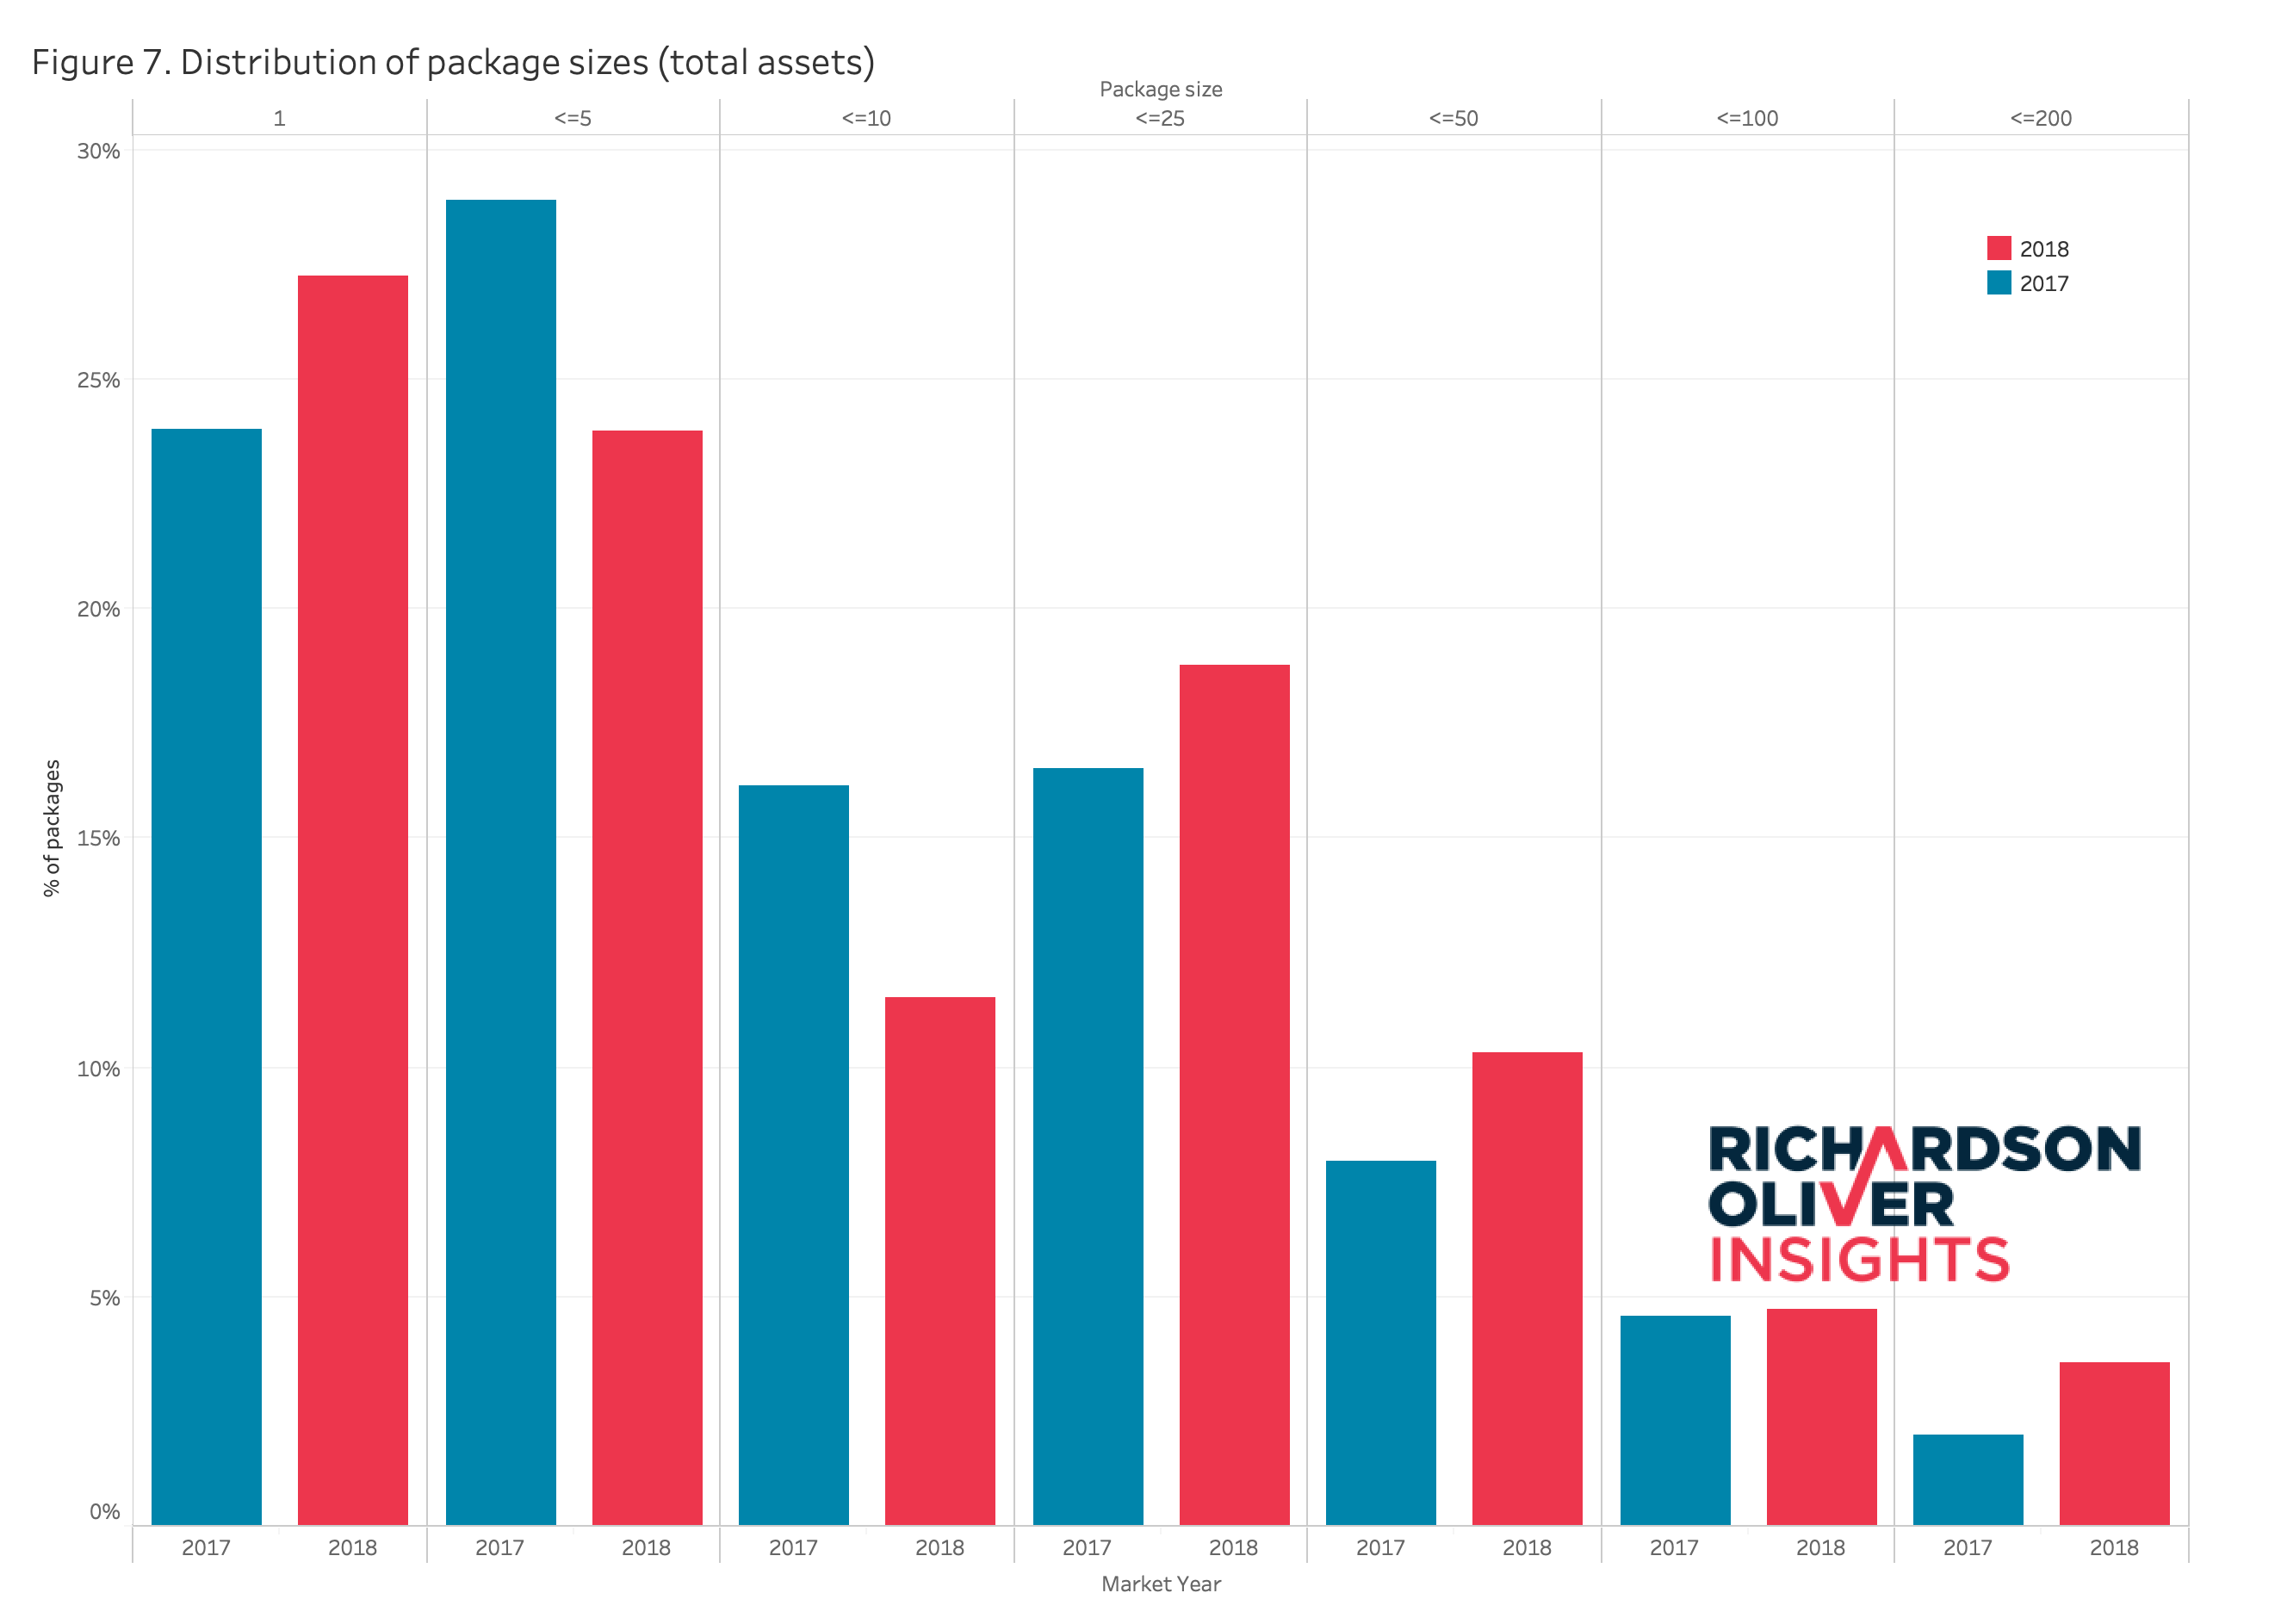 The distribution of package sizes (see Figure 7) has historically been one of the most consistent attributes of the brokered market. This year, we have observed two interesting trends. For the first time, single-asset packages are the largest group of packages on the market at 27%. Despite this, the slow and steady shift to smaller packages seems to have reversed. This year, 63% of packages contained 10 or fewer assets. This reverses the trend we have seen in the previous three market years, where the numbers rose from 66% to 69%. Despite the reversal, the 2018 market still focuses on smaller packages that are more marketable. Furthermore, there was a decrease in the percentage of packages in both the 2-5 and 6-10 asset ranges and an increase in all of the package asset ranges larger than 10. It appears that the marketing strategy for sellers may be moving towards listing either extremely small packages or slightly bigger packages that may appeal to more buyers. Alternatively, this could be representative of the increased focus on marketing the international counterparts, thereby listing more assets when filing was done in multiple jurisdictions. We will continue to monitor this to determine if any new trends appear. Despite the increased percentage of single-asset packages, the total number of assets listed increased significantly due to the number of larger packages. This increased the average number of assets per package in 2018 to 16.9. Though this is the highest average package size we have seen since 2013, the median package size is still only five assets.
Additionally, Provenance Asset Group has listed more than 2,300 single-family packages for sale; and the IP3 style programs, designed by the buyers, also tends to focus on smaller packages. So, the trend towards smaller packages does appear to be consistent across both buyers and sellers.
In our next article, we will discuss patent pricing.


![[Advertisement]](https://ipwatchdog.com/wp-content/uploads/2024/04/Artificial-Intelligence-2024-REPLAY-sidebar-700x500-corrected.jpg)
![[Advertisement]](https://ipwatchdog.com/wp-content/uploads/2024/04/UnitedLex-May-2-2024-sidebar-700x500-1.jpg)
![[Advertisement]](https://ipwatchdog.com/wp-content/uploads/2024/04/Patent-Litigation-Masters-2024-sidebar-700x500-1.jpg)

![[Advertisement]](https://ipwatchdog.com/wp-content/uploads/2021/12/WEBINAR-336-x-280-px.png)
![[Advertisement]](https://ipwatchdog.com/wp-content/uploads/2021/12/2021-Patent-Practice-on-Demand-recorded-Feb-2021-336-x-280.jpg)
![[Advertisement]](https://ipwatchdog.com/wp-content/uploads/2021/12/Ad-4-The-Invent-Patent-System™.png)


Join the Discussion
No comments yet.