
“It is easier and cheaper to reject a patent for lack of value that to analyze it for quality.”
This is part four of a six-part series on Richardson Oliver Insights’ 2018 Patent Market Report.
When discussing potential patent purchases with buyers, we continue our push to end the use of the phrase “low quality” to broadly characterize rejected patents. We often hear that there are junk, low quality or weak patents on the patent market. Clearly, there are some patents that we can objectively agree are low quality, just as there are in most portfolios. However, buyers with an efficient buying program should never test the majority of patents for “quality” metrics (e.g. enforceability) because these tests are simply too expensive. Sophisticated buyers create targeted buying programs rather than general ones. When buying, you should have a use case in mind and analyze the value of the patents in that particular context. If you want patents to counter assert against Qualcomm, do not waste time and money evaluating clean energy patents. The “quality” of anything in that technology area is irrelevant.
Buyers also tend to conflate quality and value when discussing packages. A package with no value to you for your particular business use should be rejected from your buying program, but again, this is not a comment on the quality. It is easier and cheaper to reject a patent for lack of value that to analyze it for quality. Necessarily, a well-run buying program has visibility into only a small set of the available packages on the market; for the rest of the packages, the program should have no visibility into the quality of the packages because the packages were rejected before any quality metrics were evaluated.
Based on our data, a small percentage of all packages on the market will fit a company’s specific business needs. We have proposed that this highly concentrated distribution of value in the patent market is different for each buyer and has a lognormal distribution, an extrapolation of Suzanne Harrison’s analysis of multiple corporate patent portfolios in her book, Edison in the Boardroom.
Based on this assumption, we created a tiered diligence process, seen in Figure 11, to highlight the importance of eliminating ill-fitting packages quickly.
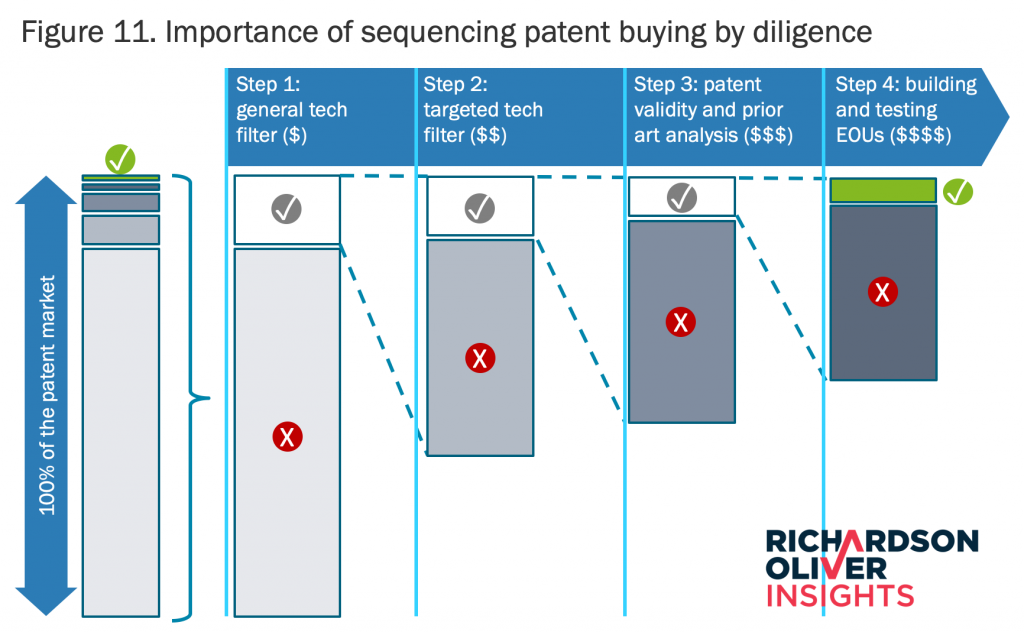
Process
The goal of this process is to identify the 1% to 2% of patents with high value to a particular buyer’s business needs–the thin sliver of green in the furthest left column of Figure 11. The first diligence stage tests the package for general technology fit (eg automotive safety systems). The entire brokered patent market is subjected to the test, and the majority will fail. The area in stage 1 with a red X signifies a large part of the market that is immediately eliminated. Patents falling into the area with the check move on to the next stage of diligence and can be seen expanded in the stage 2 column. Stage 2 tests if the technology described is something of specific interest to the client (eg follow distance and automatic braking). In order to avoid falling into an expensive quality analysis, at this stage buyers should ask themselves the following, “If I assume that the patent is perfect, would I actually want to buy it?” The answer is “no” about 70% of the time. Again, the area with the check moves to the next diligence stage.
The process continues with multiple diligence phases and two more rounds of diligence. Quality analysis does not enter the process at all until this point, after most packages have been eliminated. Stage 3 includes inexpensive tests such as remaining life of the patents, bid due dates and pricing to eliminate even more packages. Finally, in stage 4, expensive diligence is applied to around 3% of the overall market.
Table 4 shows the specific reasons that our clients gave for passing on packages when using the diligence process described above. Before we present a package to our clients, we perform the stage 1 and some of the stage 2 analysis from Figure 11 and only present packages with technology fits and matching the client’s specific buying programme metrics. Therefore, for our clients, the diligence process starts in stage 2.
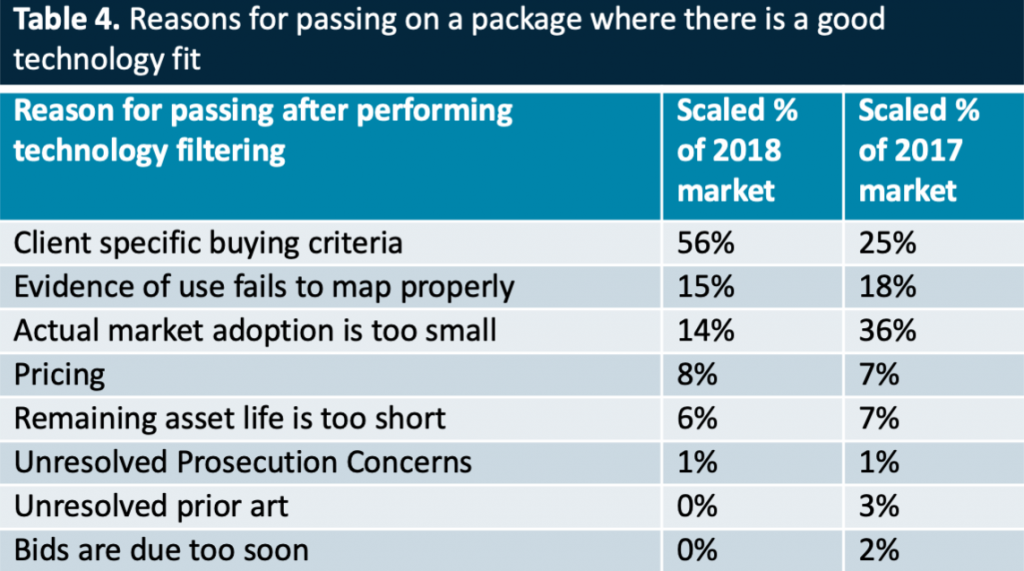
Assuming that a package passes through the initial technology filtering, the number one reason for passing on a package in the next stage is that it does not fit the client’s specific buying criteria (56%; 25% last year). These buying criteria are usually factors such as a minimum requirement for years of remaining life, a specific group of unlicensed companies, or a requirement for a German counterpart. This type of criteria can be applied as a light diligence step and can be performed with fewer resources than later stages. The next two reasons for passing require a bit more diligence. “Evidence of use (EOU) fails to map properly” (15%) requires the manual review of claim charts. “Actual market adoption is too small” (14%) requires evaluating the market adoption of the technologies described in the listed packages and confirming they were not broadly adopted. These two categories, along with “unresolved prosecution concerns” and “unresolved prior art,” are the most expensive diligence categories. They account for approximately 30% of the failed diligence at this later diligence stage, but because they are applied at the end of the filtering process, they are only performed on 5% of the packages on the market. Many packages can be filtered out before our clients even see the assets. This saves time and money in the diligence process.
If you are a new buyer, you might have thought that pricing or the timing of bids would cause a lot of issues. However, these factors rarely cause problems. Pricing tends to be more rational, especially when a broker is involved. Additionally, the market is still relatively thinly traded so although there is an advantage to bidding and closing early, early bidding is not critical to success (it is a good practice). Buyers know that the price and due dates are typically not firm and that good communication on both sides can help here.
Sales
The number of transactions continues to grow. We tracked more transactions last year, 191 packages sold, than we have seen in any previous market year. In the 2017 market year, 125 packages transacted, and our previous high-water mark was 2015, with 160 packages transacted. Additionally, we see sales of older packages exceeding our projections. For example, we are still seeing sales from packages listed in 2012—30% of the asset’s lives are over, and they are now just selling. Generally, highly sought-after packages move fast, followed by a long tail of additional sales. As a seller, patience can pay off.
We began tracking sales in order to avoid presenting sold deals to our clients. We wrote code to parse the USPTO assignment data and to identify deals that were no longer on the market. This enables us to analyze what was selling and who bought it. Our methodology considers a package to have sold if at least one patent in that package is found to have an assignment corresponding to a sale. We then use the execution date of assignment for the earliest transacted patent in the package as the date of the sale (data is limited to packages received by May 31, 2018 and to sales recorded with the USPTO by August 15, 2018). When discussing sales, we switch to a different data set, which includes 3,251 packages with 797 identified sales and is measured on a calendar year basis. This sample set includes packages that were analyzed in our previous papers and goes back to packages listed as early as 2011.
Our sales rate for 2017 listings within a year of listing currently stands at 13.9%, which is higher than last year’s rate of 10.3% for the same relative timeframe. Both the number of sales from 2017 calendar listings and the number of sales regardless of listing year are up from last year’s data. Taking this into account, we predict the sales rates of 2017 listings to be higher than the rates observed for 2016 (Figure 12). We estimate that, for 2017 listings, the sales rate for packages on the market for one year will be approximately 15%. We also created a projection of the future sales for 2017 listings for an additional two years. Additionally, we observed older sales that we had not predicted. An additional 0.54% of packages listed in 2014 sold this past year, and a few packages sold from earlier years. This suggests that buyers are reviewing a back catalogue of deals as their buying needs change. The ability to do this is a sign of sophistication and a good sign for the market as a whole.
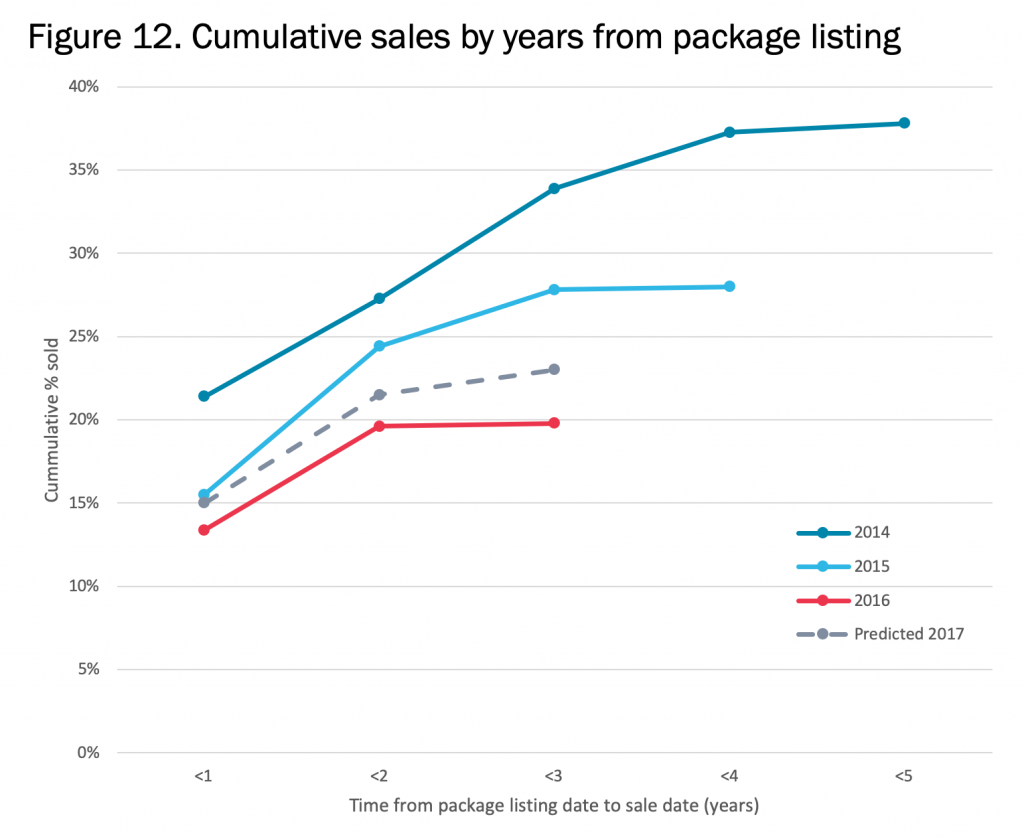
Please note that, due to the time to sale, all sales data lags behind the listings market by 18 months (and potentially longer). This is the reason for why we focus our sales rate analysis on packages listed in 2017 and not 2018 listings.
Sales by Package Size
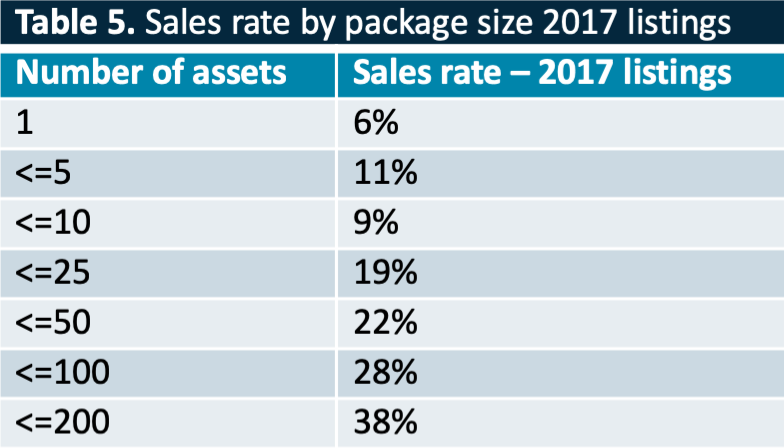
We analyzed the sales rate based on the size of the package listed and found with the exception of a spike in sales among packages in the 2-5 asset range, the larger the package, the more likely it was to have sold (see Table 5). The sales identification methodology skews towards identifying sales of larger packages because if any asset in the package sells, the package is considered sold. This year, the sales rate of packages correlates to the package sizes more so than other years. This implies that cherry picking assets from larger packages is likely occurring more often. However, if package size was the only driving factor, the sales rates should be much higher for large packages. A package with 50 assets is nowhere near 50 times as likely to sell as an individual asset package; therefore, buyers are still generally focusing on assets in smaller packages. Using this framework, packages in the 2 to 5 asset range continue to sell extremely well, with the rate of 11% (same as last year).
Sales by Receipt Date
When buying a package, it is an advantage to move quickly. We know that corporate decisions include a lot of sign-offs, which take time. So, how fast do you need to be? We analyzed how quickly the sold packages listed in the 2017 calendar year transacted in order to estimate how much time buyers have to bid. We may be hitting the limit of how fast companies can reasonably source, perform due diligence, and negotiate a deal, but buyers were able to increase their speed slightly over last year. Figure 13 shows that 80% of the sales from that for 2017 listings occurred between six and seven months from the receipt date of the package (down from just over eight months last year). But the fastest movers were not able to pick up the pace; around 44% of the packages sold in the first four months (up from 40%). Accelerated decision-making continues to be an advantage. If it is possible, getting a budget for patent purchase pre-approved by the board can help you to buy quickly and get access to the widest variety of packages.
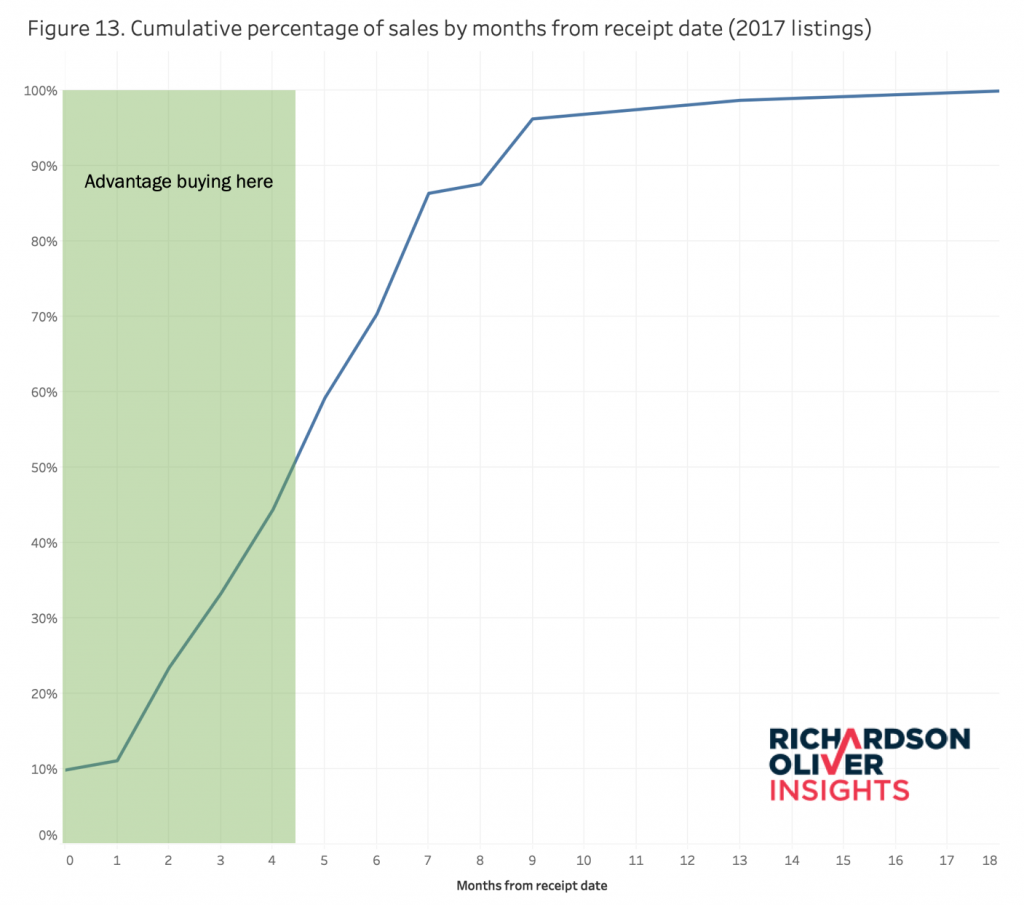
The numbers above only look at 2017 calendar year listings, which have had at most 18-months on the market. As time moves on, and additional packages sell, the earliest sales will definitionally make up a lower percentage of the total sales. When we look at an older dataset, 2014 listings, we see that 58% of the sales occur in the first year. While moving fast is still very important, there is also a long tail of later sales showing that a slow trickle of sales exists for years after packages are listed. As buying programs become more sophisticated, and as more tools are used to analyze the market, the easier it becomes to act fast at the time and to re-examine packages when buying criteria changes. A quick flurry of buying and review occurs on new packages, followed by a slower second wave of sales starting around 18 months after listing.
Sales by EOU Provided
This year, we continued to see an increased sales rate for packages which have a seller-provided EOU: packages listed in the 2017 calendar year with EOUs were 51% more likely to sell than packages without. We hear buyers say that the broker EOU is not helpful, but the data suggests otherwise. It acts as a reality check that the technology is adopted. These EOUs also act as a guide, directing potential buyers to the value drivers, and identifying the applicable technology and product market. By combining the increased likelihood of a sale and the 43% sales price premium associated with EOUs, the expected value of a package with an EOU is 116% greater.
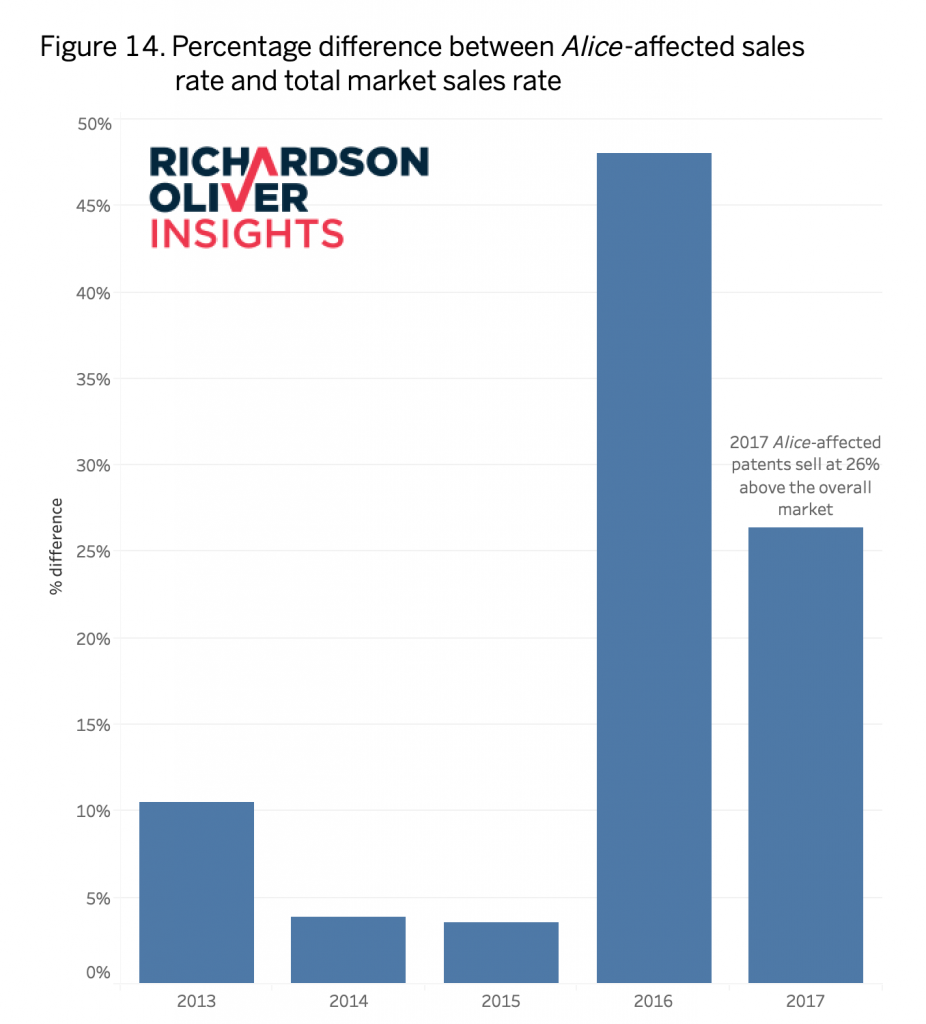
Life after Alice
Alice-affected software and financial packages are back. As discussed above, the prices rebounded, but the sales rates have also rebounded above the market average. As can be seen in Figure 14, packages from Alice-affected technology categories listed in 2016 are 48% more likely to sell than packages in the overall market. The trend has continued to a lesser extent for 2017 listings, at 26% more likely to sell. It seems that the broader fear of Alice has subsided, but when we look at the tech area most likely to be affected—financial technology—it is a little less clear. While financial tech now has the highest asking prices, the sales rates vary widely; 2016 listings were 60% more likely to sell, whereas 2017 listings were 18% less likely. We will continue to monitor this technology area to see if a trend emerges.


![[Advertisement]](https://ipwatchdog.com/wp-content/uploads/2024/04/Artificial-Intelligence-2024-REPLAY-sidebar-700x500-corrected.jpg)
![[Advertisement]](https://ipwatchdog.com/wp-content/uploads/2024/04/UnitedLex-May-2-2024-sidebar-700x500-1.jpg)
![[Advertisement]](https://ipwatchdog.com/wp-content/uploads/2024/04/Patent-Litigation-Masters-2024-sidebar-700x500-1.jpg)

![[Advertisement]](https://ipwatchdog.com/wp-content/uploads/2021/12/WEBINAR-336-x-280-px.png)
![[Advertisement]](https://ipwatchdog.com/wp-content/uploads/2021/12/2021-Patent-Practice-on-Demand-recorded-Feb-2021-336-x-280.jpg)
![[Advertisement]](https://ipwatchdog.com/wp-content/uploads/2021/12/Ad-4-The-Invent-Patent-System™.png)


Join the Discussion
No comments yet.