

“The next frontier for university technology transfer will likely be in the transformation of data-rich sectors using artificial intelligence (AI) and machine learning technologies. One area largely accumulating data is the healthcare sector. Medical knowledge is doubling every 73 days, yet we are barely scratching the surface of utilizing this data.”
Over $71 billion USD was spent in federally sponsored research at universities in 2018 in the US alone. Approximately $2.94 billion in licensing revenue was generated in 2018 directly from the process of taking academic inventions to market, otherwise known as technology transfer (TT). Including federal laboratories, the US invests more than $100 billion each year in federal research funding, with a cumulative spending of more than a trillion dollars over the last 15 years. In this article, we report trends in academic TT from surveys and literature and provide perspective on the future directions of the field.
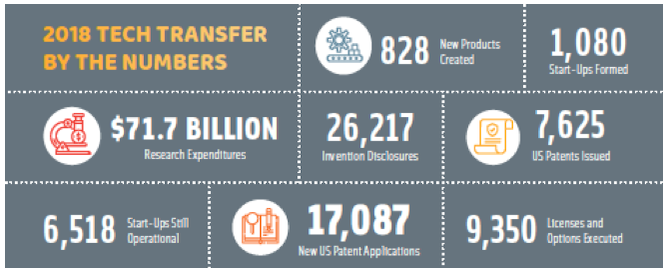
Figure 1. This dashboard shows the metrics reported by AUTM for 2018, exhibiting the impact of technology transfer in the US.
There have been several high-profile hot takes on academic TT in the past several years, claiming that by-the-numbers TT is a failing endeavor. Leaders of TT argue, with merit, that this criticism misses the point and overlooks the fact that TT is able to improve the public good through commercializing federally funded inventions. We agree with the latter viewpoint and examine TT numbers to shed more light into this field. University administrations and other stakeholders evaluate technology transfer offices (TTO) via 1) revenue generated, 2) licenses executed, 3) startups created, 4) invention disclosure forms (IDF) received, and 5) patents issued. In this piece we examine AUTM’s STATT survey data that measures these indicators for all years in which most data is available (2008–2018) and provide context and graphics of interest.
Licensing revenues as a performance indicator
While revenue is a cornerstone performance indicator in business, its use as an indicator of performance is a touchy subject for TTOs. Only a small proportion of the total sales from the licenses goes back to the university TTO. For example, consider a university TTO with a $10 million annual budget: according to a survey conducted by AUTM, the median royalty received by universities is approximately 2% of product sales. The TTO typically receives around 25% of those royalty revenues that is received by a university. Therefore, for the TTO to break even the university needs to receive $40 million in royalties, which requires $2 billion in cumulative sales for the companies licensing university IP! That is a lofty goal and most universities fall short. The exceptions are unicorns, where single licenses earn the university hundreds of millions (e.g., Lyrica from Northwestern brought $1.4 billion). This is why revenues do not tell the whole story of academic technology commercialization; most revenues are generated by a miniscule subset of licenses. Yet, STATT reports $2.94 billion in total revenues in 2018. Assuming the median 2% royalty rate, that implies about $147 billion in sales of products derived from academic technology. Not bad in terms of ROI from $71 billion. In line with the spirit of the Bayh-Dole Act of 1980, another measure of efficiency for the TTOs are the number of licenses.

Figure 2. The top 20 individual universities with the most gross licensing revenue compared with the number of executed licenses from 2008–2018 according to STATT data. Three university systems had high revenue number but are excluded because they don’t report individual statistics: The University of California System with $1,513,052,284 in revenue and 2448 licenses, The University of Texas System with $694,903,592 in revenue and 1601 licenses, and The University of Massachusetts System with $387,504,344 in revenue and 280 licenses. Missing data: City of Hope NMC (2014–15), Princeton University (2008–10).
Patenting on a budget
It is no surprise that there is a positive correlation between patents issued and licenses executed (and startup creation and revenues earned). Despite this, the federal government disallows any of the $71 billion in research funding to be spent on filing patents to protect inventions. Yet, in 2018, universities spent over $425 million in patent-related legal expenses. Anyone who has worked at a TTO can attest to the challenge of managing a portfolio of patents on a shoestring budget. Patents are expensive and there are never enough funds to file for patents on all of the inventions that warrant protection. As a result, more than 95% of foreign rights are never protected, and less than 30% of patents are ever converted to a full patent from the provisional filing. This problem is compounded by other challenges including the inability to protect some gene-based and software inventions through patenting, which has an outsized effect on academic research institutions.
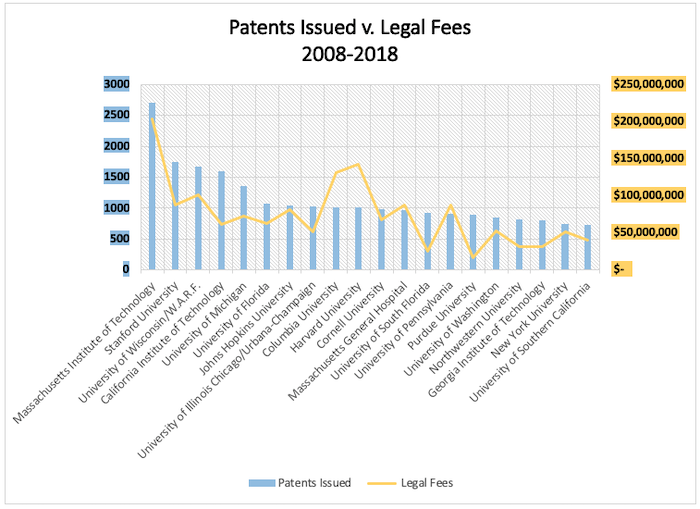
Figure 3. The top 20 individual universities with the most patents issued from 2008–2018 compared with legal expenditures according to STATT data. Two university systems had high numbers of patents issued but are excluded because they don’t report individual university statistics: University of California with 4335 patents issued and $ $426,655,283 in legal fees and The University of Texas System with 1883 patents issued and $99,084,203 in legal fees. Missing data: University of South Florida (2009).
The shift to startups
In recent years there has been a paradigmatic shift towards commercializing technology through startups. There is a universal understanding that university inventions are in early technology readiness level and need substantial development to be ready to go to market. Many universities have taken it upon themselves to fund some of the startups, sometimes co-funding alongside venture funds. The trend of the top-20 universities for initiated startups (2008–2018) provides several trends of interest. As expected, the Silicon Valley, Cambridge and other mature startup “ecosystems” create a huge number of startups. Yet other noteworthy regions have built strong reputations for startup creation as well. Factors that influence the rankings include 1) access to funding, 2) access to entrepreneurs, and 3) an ecosystem of other startups and similar companies. Critical factors that enhance startup success is the stability of the parent TTO (e.g., Columbia University), leadership and support from the university (e.g., Purdue University), support from the alumni (e.g., University of Florida and University of Michigan), and size of available research funding (e.g., University of Washington and University of Pennsylvania).
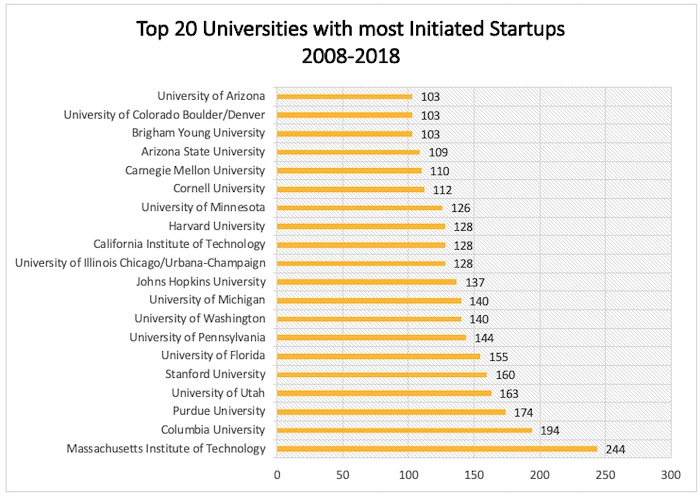
Figure 4. The top 20 universities with the most startups initiated from 2008–2018 according to AUTM STATTs database. Four university systems had high numbers of startups issued but are excluded because they don’t report individual university statistics: University of California System with 785 startups, University of Texas System with 277 startups, University System of Maryland with 121 startups, and the Research Foundation of SUNY with 108 new startups. Missing data: University of Colorado (2014), University of Utah (2016).
Although the total number of startups from the academic world is very small compared to the overall national numbers, the impact of these spinouts on the economy is substantial. Stanford University alone originated giants including Google, Cisco, and HP. Survival rates, funds raised, and successful exits are all higher among university/alumni-based startups that are based on university-licensed technology. Furthermore, in addition to high technology, startups from universities include a large number of impactful biotechnology and gene therapy companies, such as Juno Therapeutics (Fred Hutchison Cancer Research Center, Memorial Sloan-Kettering Center, and Seattle Children’s Research Institute). When Juno sold to Celgene for $9 billion, the primary investor in the company (ARCH Ventures) received 23x return on their 15% stake. Endocyte Inc. from Purdue University (acquired by Novartis AG for $2.1 billion) and AveXis from Nationwide Children’s Hospital and Ohio State University (acquired by Novartis AG for $8.7 billion) are other notable examples. While the dollar figures might be astonishing for some of these exits, the impact of these life science companies over the last four decades has also been enormous. A study by Dr. Ashley Stevens et. al. of Boston University found 153 new drugs and vaccines were developed by public research institutions between 1981 and 2011.
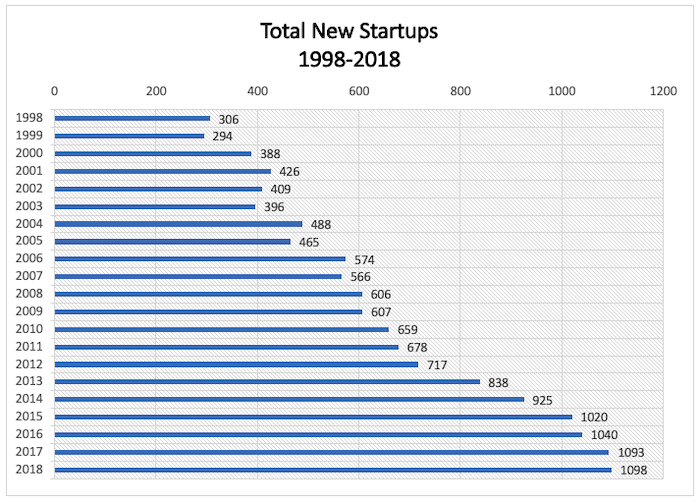
Figure 5. The number of startups more than tripled in 20 years, from 306 in 1998 to almost 1098 in 2018. This can be attributed to a sustained effort by universities to incubate early-stage technologies through startups.
Tracking invention disclosures
If patents are the finished goods of university technology commercialization, then invention disclosures are the raw materials that must first be processed and refined. We examined the cumulative number of invention disclosures between 2006–2017 at these universities and found, as would be expected, that the universities with the highest numbers of IDFs also have the highest number of patents, with several notable exceptions. University of South Florida, Northwestern University, NYU and USC have high patent numbers although they are not in the top 20 for IDFs. On the other hand, University of Minnesota, University of Pittsburgh, and Ohio State University, do not appear on the top 20 for patents although they are in the top 20 for IDFs. We analyzed the IDFs from 2006-2017 because we wanted to comparethose numbers to the total number of publications from those institutions using the Leiden CWTS publication data which displays total number of publications from 2006–2017. The most startling observation was that the number of IDFs were largely predicted by the number of publications in a 1:10 ratio. The outliers were Harvard University and University of Michigan.The smallest ratios were from engineering-focused California Institute of Technology, Massachusetts Institute of Technology, Georgia Institute of Technology, and Purdue University.
A challenge faced by all university TTOs is the huge number of research publications describing inventions that are not reported as IDFs. As we state above, most TTOs do not have the budget to file patent applications on every promising IDF. This is discouraging for faculty who in turn do not report subsequent inventions. There are also faculty members who do not believe in filing patents and want their research to remain in the public domain. These factors are perhaps the biggest opportunity in the field of technology commercialization; if the research is not disclosed, then less intellectual capital reaches the market.
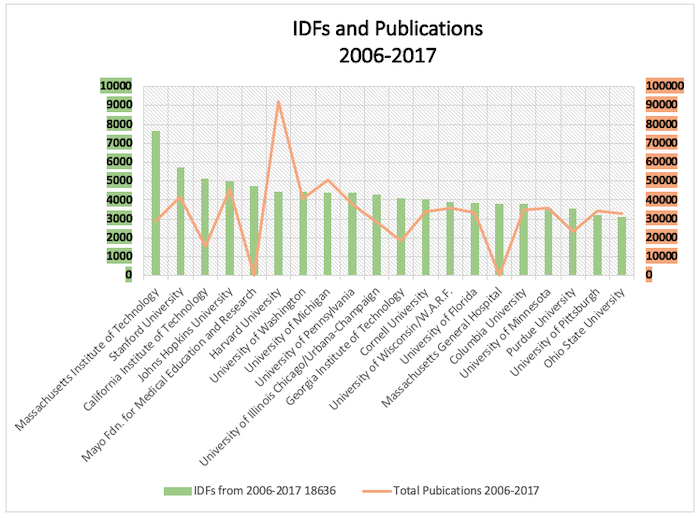
Figure 6. The top 20 universities with the most invention disclosure forms (IDFs) (green) and number of publications (orange) for 2006–2017. Note that hospital publications are not tracked by Leiden and they were excluded, as were the university systems University of California with 18636 IDFs, University of Texas with 7293 IDFs, Research Foundation of New York with 3409, and University System of Maryland with 2742 IDFs. Publication numbers were not available for the Mayo Foundation of Medical Education and Research and the Massachusetts General Hospital.
Where will we go next?
In the early days of TT, universities could not have predicted how this profession would change the face of the US economy and the impact it would have overall. Consider the following revolutionary changes that have taken place at universities and TTOs:
- For many years, there was a small number of entities leading the way (e.g., Iowa State, WARF, Stanford, and MIT), yet their focus was solely to license technology to a company that would advance it to market. Startups were not a priority, and universities were not focused on creating startups. Furthermore, economic impact factors like job creation and products in the market were not tracked by either TTOs or university administrations.
- Other than several notable exceptions (e.g., Dr. Robert Langer of MIT), faculty entrepreneurs were practically nonexistent, in fact, it was looked down upon. Now, this behavior is encouraged by most universities. Likewise, patents were not considered a metric of success for tenure-track faculty. Today, patents are considered a strong addition to tenure review packages.
- Universities were not in the business of incubating startups, and they were certainly not investors taking equity stakes. Today, following the realization that startups could be more impactful than licenses, many universities maintain seed funds and early-stage startup funds.
- Commercialization of technology was not a priority for universities and did not factor into their strategic outlooks. Today, many universities list technology commercialization in their top-5 strategies and university presidents often mention TT as a key differentiator of the university, with faculty recruitment visits involving a meeting with the TTO.
- Universities are heavily investing to benchmark patent licensing practices in industry. Many TTOs have adopted best practices from industry and hire licensing staff directly from industry. Although resources remain scarce, they maintain in-house executive leadership and staff a business development team. TTOs are big business now and will continue to have an outsized impact on the economy.
- The #techtransfer industry has been transformed for the better and organizations like AUTM and Bio allow for the impact of the TTO to be measured. Like any other industry, it is evolving; TT has become a multifaceted sector that manages early-stage investing, research collaboration, economic development, and technology development.
- The next frontier for university technology transfer will likely be in the transformation of data-rich sectors using artificial intelligence (AI) and machine learning technologies. One area largely accumulating data is the healthcare sector. Medical knowledge is doubling every 73 days, yet we are barely scratching the surface of utilizing this data. With our computing power today and the new era of AI we are at the cusp of a healthcare revolution. Academic institutions are sitting on massive amounts of valuable data that is vastly underutilized, and research institutions will soon begin to recognize and develop healthcare data into the next revolutionary asset.


![[Advertisement]](https://ipwatchdog.com/wp-content/uploads/2026/06/Womens-IP-Forum-2026-sidebar-700x500-rev2.jpg)


![[Advertisement]](https://ipwatchdog.com/wp-content/uploads/2021/12/WEBINAR-336-x-280-px.png)
![[Advertisement]](https://ipwatchdog.com/wp-content/uploads/2021/12/Ad-4-The-Invent-Patent-System™.png)


Join the Discussion
5 comments so far.
Amitkumar Patel
April 13, 2020 01:57 amDear DJ & Team,
It is very informative and insightful article, and showing up way as well the challenges involved in TT and Commercializing a technology for value creation from the knowledge.
Thanks
Amit
Anon
April 9, 2020 12:15 pmTalk about a collection of elements for a perfect storm in the war of patent eligibility….
Maybe our friend TFCFM could wade in and ask for you all to provide some “real inventions”….
DJ Nag
April 8, 2020 10:48 pmJohn,
Thank you for your very kind words. Coming from you it means a lot. We all have to endeavor to educating the public about the importance of tech transfer. I am just trying to do a little bit.
Regards,
DJ
Richard Abramson
April 8, 2020 06:43 pmThank you for a very informative piece. I would note the omission — which, unfortunately, tends to be endemic — of any reference to non-profit scientific research organizations like SRI International, Battelle, Research Triangle Institute and others, which develop and commercialize federally-funded technologies as well, and (taking SRI as an example) have spun off companies like Intuitive Surgical, Nuance Communications and Siri.
John Fraser
April 8, 2020 08:09 amDJ. Very good article. Together with the IP Watchdog Seminar on April 14 re organizations and approaches to battling Corvid-109 and the role university research plays, this will continue the conversation as to why taxpayers monies are needed to propel research into disease. It’s good that the University community is being recognized for its role in the fight and how the ‘Ivory Tower’ is really getting a move on to respond at the speed the disease is spreading.