
”Making decisions based on data may allow the portfolio manager to find opportunities to improve the company’s patent portfolio, to find opportunities to improve efficiency for growing and managing the company’s patent portfolio, and to reliably make rational decisions on these opportunities.”

A patent portfolio can be one of the greatest assets that a company owns. A patent portfolio may boost a company’s valuation for a stock offering or a sale, may be licensed for recurring revenue, may be sold to raise cash, or may be enforced to seek monetary damages or to exclude competitors from the market. However, growing a patent portfolio can be expensive. For this reason, many companies hire a portfolio manager to balance the value and expense of growing and maintaining the patent portfolio.
A portfolio manager may be responsible for making decisions including a total target number of patent filings, target numbers of patent filings for different technology areas of the company, patent firms to use for filing and prosecuting patent applications, or how to manage costs per issued patent. The portfolio manager can improve the decision-making process by using data-driven decision making. This article shows some examples of data-driven decision making.
Audit of a Current Patent Portfolio
For a company that already has a patent portfolio, a portfolio manager should regularly review performance data of existing patent firms that the company uses for filing and prosecuting patent applications. Below is an example report, based on 2019 issued patents, with statistics on law firms that perform patent prosecution for one of the top patent filers in the United States.
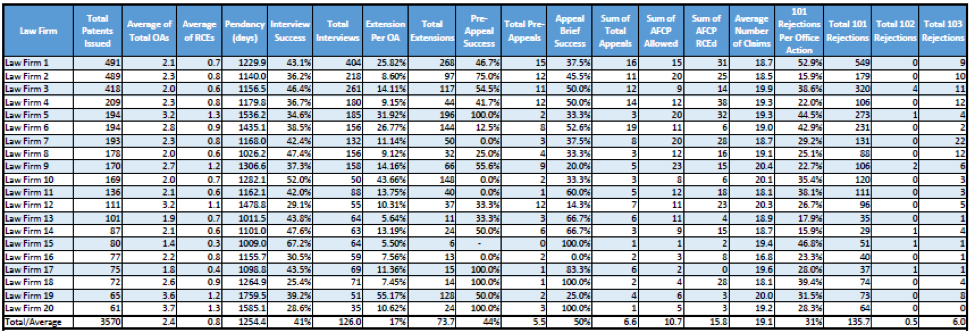
Table 1
From Table 1, the portfolio manager can see statistics for prosecution efficiency (e.g., average of total OAs, average of RCEs, etc.), extra fees during prosecution (e.g., extensions per OA, average of RCEs), and responsiveness to developments in patent law (e.g., Section 101 rejections per office action), among other valuable information.
For example, Law Firm 15 (1.4), Law Firm 17 (1.8), and Law Firm 13 (1.9) receive allowance with a lowest average number of Office Actions (OAs), while Law Firm 20 (3.7), Law Firm 19 (3.6), Law Firm 12 (3.2), and Law Firm 5 (3.2) receive allowance with a highest average number of OAs. Because law firms charge attorney fees for each OA response, a high number of OAs corresponds to high costs for prosecution. The portfolio manager may consider:
1) sharing the statistics on OAs with existing law firms to encourage the existing law firms to compete,
2) awarding additional work to existing law firms that receive allowance with a lowest average number of OAs, and/or
3) reducing amounts of work sent to existing law firms that receive allowance with a highest average number of OAs.
Law Firm 19 (55%), Law Firm 10 (44%), Law Firm 5 (35%), Law Firm 6 (27%), and Law Firm 1 (26%) take extensions on more than 1/4 of all office actions. This is particularly interesting because the law firms are ordered by volumes of issued patents handled by the law firms and some of the highest-volume law firms for the company take the most extensions. Extensions increase patent fees and, generally, provide no added value to the client. Reducing or eliminating these extension fees may be the easiest way for a portfolio manager to reduce expenses associated with a company’s patent portfolio. The portfolio manager may consider 1) sharing the statistics on extensions with the existing law firms to encourage the existing law firms to compete, 2) awarding additional work to existing law firms with a lowest average number of extensions per application, and/or 3) reducing amounts of work sent to existing law firms with a highest average number of extensions per application.
Law Firm 1 (53%), Law Firm 15 (47%), Law Firm 5 (44.5%), and Law Firm 6 (43%) receive a highest percentage of §101 (subject matter patent eligibility) rejections. The percentage of Section 101 rejections may reflect responsiveness to developments in patent law regarding patent eligible subject matter. For example, Section 101 rejections may be more-easily avoided or overcome when a drafting attorney describes a technical problem that is addressed by a technical solution described in the application. The portfolio manager may consider:
1) sharing best practices from law firms with a lowest average number of Section 101 rejections per office action,
2) sharing the statistics on Section 101 rejections with existing law firms to encourage the existing law firms to compete,
3) awarding additional work to existing law firms with a lowest average number of Section 101 rejections per application, and/or
4) reducing amounts of work sent to existing law firms with a highest average number of Section 101 rejections per application.
Although Table 1 gives the portfolio manager quantitative insights into the current patent portfolio, the portfolio manager should also consider qualitative factors when evaluating the patent portfolio and existing law firms. For example, if the company files some patent applications related to a standard (e.g., a telecommunication standard), prosecution may be more rigid, and may have extra office actions, because there is less flexibility for amending claims. In another example, prosecution for applications involved in litigation (e.g., with claims directed to an accused infringer’s product) may also be more rigid because the claims cannot be amended to exclude the accused infringer’s product. In yet another example, the company may have a set of patent applications that the company intentionally keeps pending so the company has flexibility to file continuations with claim sets that read on a competitor’s product. Further, the company may file some applications in a technology area (e.g., business methods) that is difficult with respect to Section 101. These examples show how some law firms may have quantitative indicators of poor performance even though the quantitative indicators are based on qualitative differences in applications sent those law firms. For these reasons, the portfolio manager should evaluate law firms based on qualitative factors in addition to quantitative factors from the data.
Finding a New Law Firm
A portfolio manager may determine that a law firm is underperforming and should be replaced. For example, Law Firm 5 of Table 1 uses the fourth most OA responses for allowance, takes the third most extensions per OA, and receives the third most Section 101 rejections per OA. Unless qualitative factors explain the quantitative indications of poor performance, the portfolio manager may consider replacing Law Firm 5 with a new law firm. When selecting a new law firm, the portfolio manager may request writing samples, firm statistics, and interviews to determine if the new law firm is a good fit for the company. Below is an example report, based on 2019 issued patents, with firm statistics on law firms that received at least 24 issued patents in a technology group in which the company received the most issued patents. Refining a search for law firms with filters to those that received at least two issued patents per month in the technology group in which the company received the most issued patents may provide results on law firms with relevant experience and sufficient bandwidth to handle enough patents to make it worth the effort to hire one of the law firms.
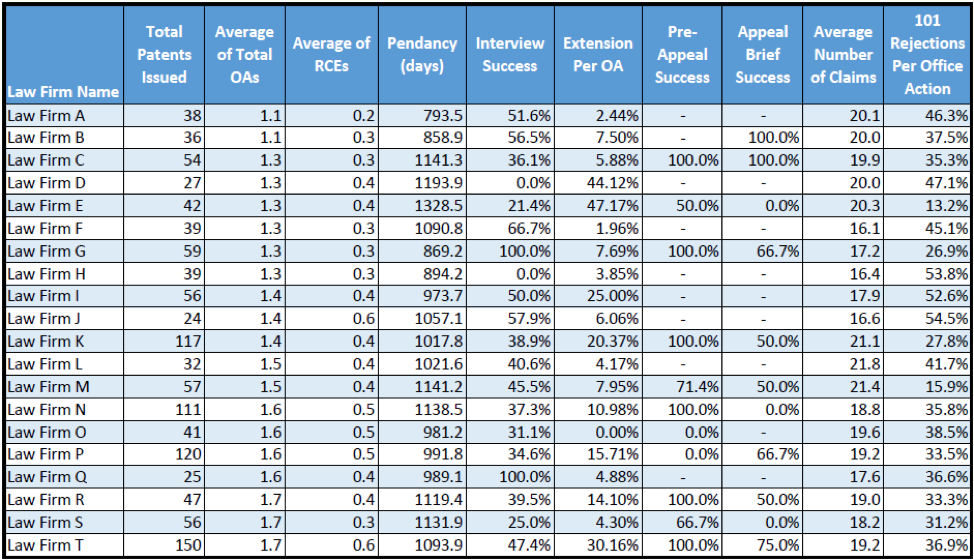
Table 2
From Table 2, which shows the top 20 law firms based on an average number of OAs per issued patent, the portfolio manager may review statistics for prosecution efficiency, extra fees, and responsiveness to developments in patent law, among other valuable information. A simple analysis indicates that any of the law firms of Table 2 may provide improved quantitative performance than Law Firm 5 of Table 1. For example, each of the law firms shown in Table 2 have a lower average number of OAs per issued patent than Firm 5 (3.2) and only Law Firms D and E take more extensions than Law Firm 5 (35%). Interestingly, each of the law firms of Table 2 have a lower average number of OAs per issued patent than each of the company’s top 14 law firms (by volume). This may indicate that the company may consider replacing multiple existing law firms to receive improved quantitative performance for the patent portfolio.
Gap Analysis with a Competitor
A portfolio manager may seek to determine whether resources are being used in appropriate places within the company. For example, the portfolio manager may seek to determine if the company is filing a sufficient number of patent applications for various technologies. Similarly, the portfolio manager may seek to determine whether the company is using resources to innovate in the right technologies. Below is an example report, based on 2019 issued patents, with statistics for issued patents, for the company (in purple) and a competitor (in green), within various technologies.
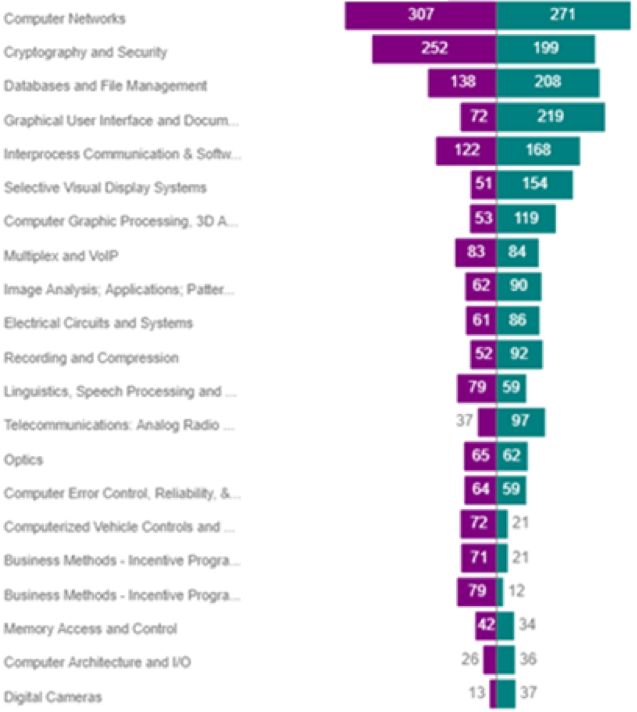
Figure 1
In Figure 1, patents issued to the company are represented in teal and patents issued to the competitor are represented in purple. From Figure 1, the portfolio manager can see where the company lags behind the competitor and where the company leads the competitor. For example, the company and the competitor have invested heavily in technology surrounding “Computer Networks” and “Cryptography and Security.” However, the company lags behind the competitor in each of these technologies. On the other hand, the company significantly leads the competitor in “Databases and File Management,” “Graphical User Interface and Document Processing,” and “Selective Visual Display Systems.” The portfolio manager may use the information of Figure 1 to determine how to allocate resources to better compete with the competitor or to maintain a competitive advantage over the competitor.
Data Can Make You a Star
Portfolio managers are responsible for making decisions to guide and direct a company’s patent portfolio. Making decisions based on data may allow the portfolio manager to find opportunities to improve the company’s patent portfolio, to find opportunities to improve efficiency for growing and managing the company’s patent portfolio, and to reliably make rational decisions on these opportunities. These data-driven decisions can make the portfolio manager a star within the company, as the portfolio manager is able to improve a return on investment by the company into the patent portfolio.
Note: All data is derived from a database maintained by the author’s firm.
![[Advertisement]](https://ipwatchdog.com/wp-content/uploads/2024/04/Patent-Litigation-Masters-2024-sidebar-early-bird-ends-Apr-21-last-chance-700x500-1.jpg)

![[Advertisement]](https://ipwatchdog.com/wp-content/uploads/2021/12/WEBINAR-336-x-280-px.png)
![[Advertisement]](https://ipwatchdog.com/wp-content/uploads/2021/12/2021-Patent-Practice-on-Demand-recorded-Feb-2021-336-x-280.jpg)
![[Advertisement]](https://ipwatchdog.com/wp-content/uploads/2021/12/Ad-4-The-Invent-Patent-System™.png)


Join the Discussion
5 comments so far.
Anon
July 28, 2020 08:22 amMaxDrei,
Maybe you can unwind what you are trying to get at and speak plainly.
Your first point asks a question, but I am not certain what any answer would provide.
It either ‘could be’ or it ‘could not be’ that corporation in Japan have been taking a certain approach for decades.
So what?
What is your point?
Your second point is also somewhat inane. What are you getting at? Are you suggesting a (any?) particular set of data points for which the evaluation of European patent law firms should be undertaken with? Are you trying to say that with your experience, all one needs to use for evaluation purposes is some (different?) set? One that is ‘easy to access?’ But it is unclear whether this is what you are saying, and if it is NOT what you are saying, then the observation that items are ‘easily mined’ has NO BEARING on the point of the article, so why offer that?
You seem to want to add something here, but I am not certain that you have added anything.
MaxDrei
July 26, 2020 05:40 amIs this data-driven approach useful, I wonder, for those (whether in house or in outside US patent counsel) who want to assess patent firms in Europe?
There are two reasons prompting my question. First, it is my understanding that corporations in Japan have been using for decades, and for this very purpose, some sort of “data-driven” approach. But how can that be?
Second, looking at the Table of data points that are counted when assessing US law firms, I note that more or less all of them are of no assistance under the EPC. What data points would one rely upon, when looking at European patent law firms? Perhaps even just a few fields in the Table would be enough, easily mined from the data the EPO makes available to the public.
Mark Nowotarski
July 24, 2020 01:37 pmThanks for the tip on LEDES. Interesting organization.
R Hunziker
July 24, 2020 11:25 amOne issue with “data-driven decision making” is access to quality data, preferably in a standard format. LEDES attempted to develop an XML data format for portfolios, starting with the disclosure, but never generated significant engagement from inhouse counsel. At least it may be a good starting point for others. See https://ledes.org/loc-ipmm-invention-disclosure-schema/
Mark Nowotarski
July 24, 2020 09:14 amFascinating results. I think if I were the portfolio manager for the purple company above, I might ask why are we filing so many business method patents? Right now, even after the 2019 101 guidance, I still have to pay for an average of 6 responses-to-rejections to get 1 allowance. If these cases could be reframed as technology inventions, such as Computer Networks, Cryptography or Database management, then I would only have to pay for 2 responses-to-rejections to get 1 allowance, plus my average prosecution time is cut by 3x.
A law firm that could show expertise in reframing business methods as technology inventions would certainly score high in my book.